
Talking Points:
Canadian Dollar[1] implied volatility is amongst the most elevated of its major peers Prices could be vulnerable to ongoing NAFTA talks and incoming local jobs data USD/CAD[2] could be at risk of further losses after confirmation of a reversal pattern Just started trading USD/CAD? Check out ourbeginners’ FX markets guide[3]! Canadian Dollar 1-day implied volatility is not only the most elevated of the majors at 12.45%, but also it is around a one-month high. The similar one-week measurement is also amongst the largest of its major counterparts and sits just above a two-week high. What might explain these market expectations? Perhaps political risk and incoming economic data. Implied Volatility and Market Range for the FX Majors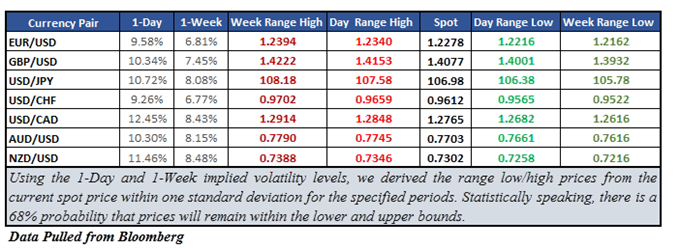 Recently, the Canadian Dollar has benefited from more welcoming NAFTA developments. On Wednesday, Canada’s Foreign Affairs Minister Chrystia Freeland noted that they are ‘making progress good progress’ on negotiations with the US. In addition, Donald Trump softened the demand for automotive content, now applying the 85% trio threshold to only critical car components. As Trump’s deadline to form a provisional pact approaches by the end of next week, the Loonie could swing depending on how these talks unfold. Meanwhile keep an eye out for Friday’s local employment report. The country is expected to add more jobs while unemployment stays the same. In addition, average hourly earnings are expected to rise by the most since October 2012. However, data out of Canada has been increasingly underperforming relative to economists’ expectations since late January. This opens the door for an unpleasant surprise which could lower hawkish Bank of Canada policy expectations and in turn hurt the currency. With that in mind, let’s take a look at where priced-in volatility may take USD/CAD. For other FXimplied volatility articles, please visit the Binaries page[4]. USD/CAD Technical Analysis: Major Down Move Coming? On a daily chart, USD/CAD has pushed below the neckline of a head and shoulders reversal pattern, falling as expected[5]. This opens the door for further losses. The ultimate target of the pattern is just above the 76.4% Fibonacci retracement level at 1.2456. But getting there will require overcoming a few obstacles. On its way lower, the “day range low” at 1.2682 might stand in the way as immediate support which is closely aligned with the 50% midpoint of the retracement. Should prices fall below that, the “week range low” at 1.2616 would be the next target. On the other hand, if prices push higher and above the neckline, the “day range high” at 1.2848 could end up as immediate resistance. A push above that exposes the “week range high” at 1.2914
