
Talking Points:
Gold prices[1] fell as USD[2] rose which also pushed oil higher as OPEC output fell The yellow metal eyes US ISM data on Wednesday, oil looks to EIA inventories Crude oil faces the 2017 trend line while gold heads for the lower channel line Find out what retail traders’ gold buy and sell decisions[3] say about the coming price trend! The US Dollar[4] put in a rather mixed performance on Tuesday, though it did rise towards the end of the day alongside local front-end government bond yields. There, sentiment improved on reports that the White House is not pursuing Trump’s attacks on Amazon[5]. Perhaps a lack of critical event risk alongside a better mood paved the way for markets to continue betting on hawkish Fed monetary policy expectations. That kind of trading environment dampened the appeal of gold, the anti-fiat asset, and sent it lower. Meanwhile crude oil prices were pushed higher. Since they are denominated in US Dollar terms, a stronger greenback inevitably made oil more expensive. In addition, prices were also boosted by reports that March’s OPEC output dropped by 170k b/d which brings it down to the lowest this year so far. Looking ahead, the yellow metal turns to Wednesday’s US economic calendar docket. There, we will get March’s ISM non-manufacturing survey. Data out of the country has been coming out slightly better than economists’ expectations as of late. If an upside surprise manages to boost the US Dollar, gold prices could be vulnerable. As for crude oil prices, official EIA inventory flow data is on the docket later today as well. API estimated on Tuesday that crude inventories dropped 3.28 million barrels last week. Median forecasts point to a much smaller increase of 1,396.8k. A result close to API’s forecast might send oil lower and vice versa. Gold Technical Analysis Gold prices seem to be making an attempt to reach the lower line of the descending channel after failing to push above the upper line during the last few days of March. Now, prices have pulled back and stopped at former resistance around 1,340.94. From here, a push above that exposes the upper line of the channel. If gold turns lower again, it will face the 38.2% Fibonacci retracement at 1,316.64.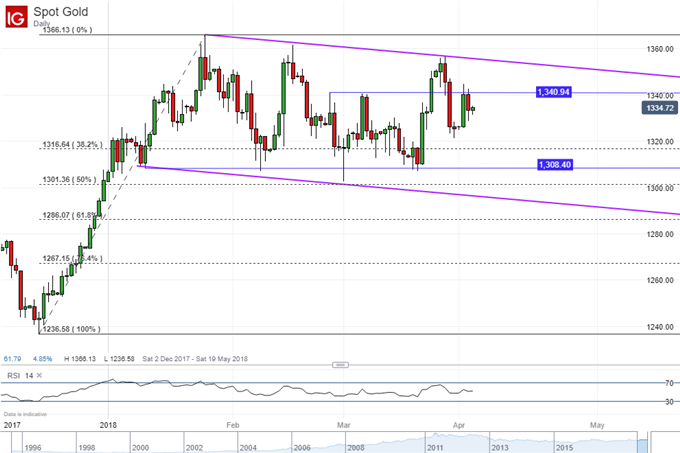 Crude Oil Technical Analysis Crude oil prices[6] are slowly making their way towards the long-term rising trend line from August 2017. Immediate resistance stands as the 23.6% Fibonacci extension at 63.74. A push above that exposes the January 25th high at 66.60. On the other hand, if prices fall through the ascending line, the next target will be the series of lows seen
