
- Q2 started with a bang across equity markets as yesterday saw another bearish drive show-up in the S&P 500[1]. A bit of support came-in around the 38.2% retracement of the post-Election move before the US close yesterday, and the S&P 500 has bounced up to find a bit of short-term resistance around an area of prior support.
- The US Dollar continues to cling to the 90.00 level in DXY[2], and this keeps the door open for a number of interesting scenarios on both sides of the Greenback. On the short-side of USD[3] are setups in both EUR/USD[4] and USD/JPY[5] that can remain interesting in the near-term, and we look at each below.
- Are you looking to improve your trading approach? Check out Traits of Successful Traders[6]. And if you’re looking for an introductory primer to the Forex market, check out our New to FX Guide[7].
Do you want to see how retail traders are currently trading the US Dollar? Check out our IG Client Sentiment Indicator[8].
US Stocks Start Q2 on a Rough Note
Yesterday’s open was not friendly to US equities[9], as a quick dip to start Q2 ran for the first part of the trading day. The S&P 500 made a fast approach towards the February double-bottom at 2,530; but a bit of support showed up around 2,550 ahead of the close with prices rallying-up to lower-high resistance. Price action[10] in US equity futures has remained largely stable in the overnight session and prices are holding on to yesterday’s support approach this morning’s open.
S&P 500 Four-Hour Chart: Pull Back to Find Resistance Around Prior Short-Term Support
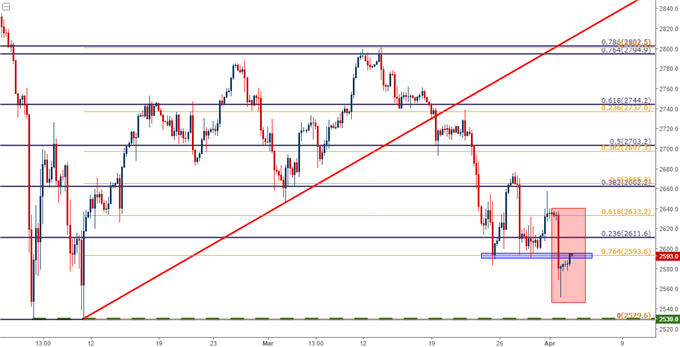 Chart prepared by James Stanley[11] At this point, prices have rallied back to the 76.4% retracement of bullish move off of the February lows; and this is an area that had previously helped to cauterize some support during last week’s sell-off. Resistance showing around prior support keeps US stocks in a bearish state as we move into the month of April, and the stage appears set for a retest of 2,530. And if that support can’t hold up after a third test, the bearish drive could grow considerably larger. Yesterday’s low came-in around the 38.2% Fibonacci retracement[12] of the post-Election move in the S&P, and this is at 2,554. Underneath that, we have that February low at 2,530, and a bit lower we have a prior swing around 2,490. The 50% retracement of the post-Election move resides at 2454, and if we can’t hold here, the door is opened for a test of the 61.8% retracement a 100-handles lower. S&P 500 Daily Chart: Potential Supports
