
Euro[1] has seen some volatile sessions recently but on whole, price action continues to trade within the March opening range. The focus is on possible failure on this decline to offer clarity on whether this pullback is just a correction or a larger shift in the near-term trend.
EUR/USD Daily Price Chart
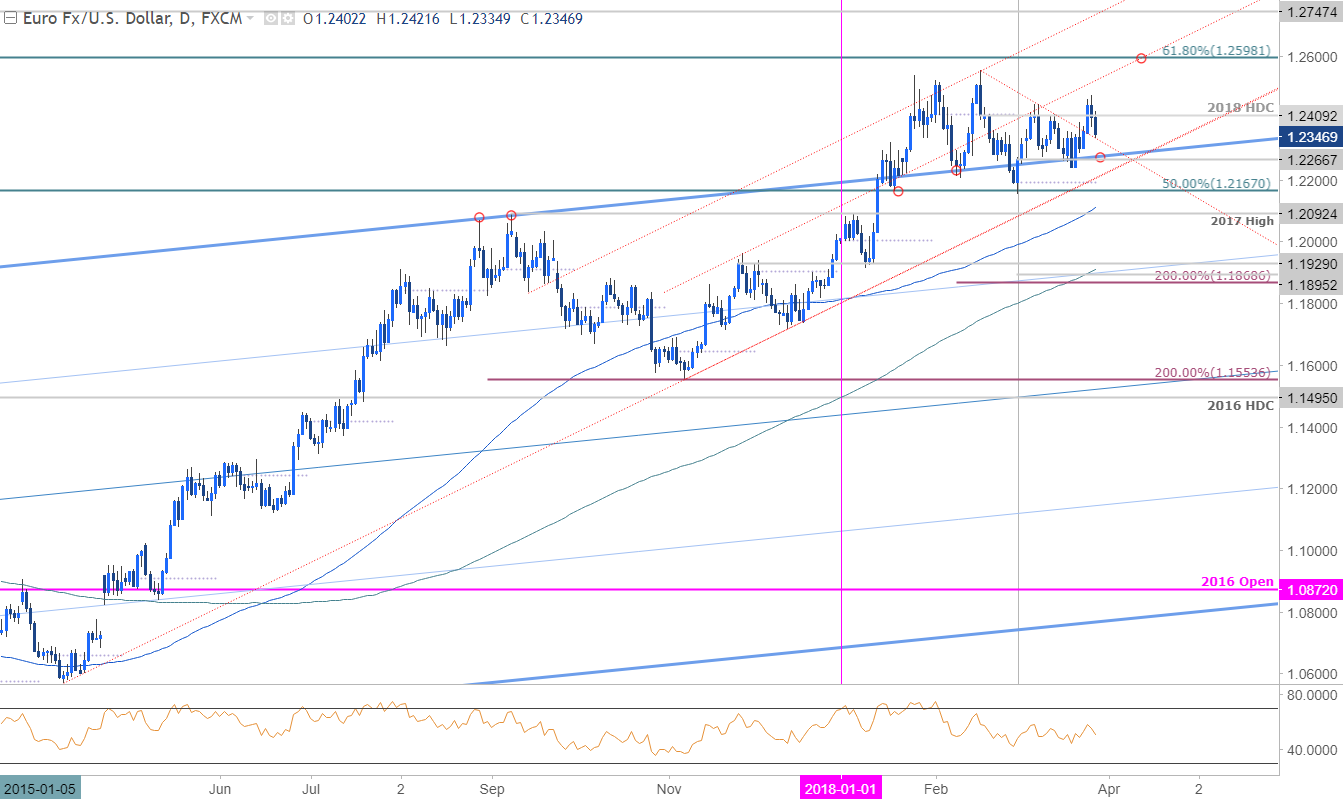
Technical Outlook: Euro broke above the February trendline on Monday with the advance failing just above the monthly opening-range highs. Price is virtually unchanged on the week with the pullback now testing former slope resistance as support. Note that daily RSI has held between 40-60[2] since the February decline and fails to offer any clarity here.
That said, the longer-term outlook noted in this month’s EURUSD Technical Perspective[3] remains unchanged and the, “broader focus remains on a break of the 1.2167-1.2598 range for guidance with the risk weighted to the topside while above confluence support at 1.2167.
New to Forex[4] Trading? Get started with this Free Beginners Guide[5]
EUR/USD 240min Price Chart
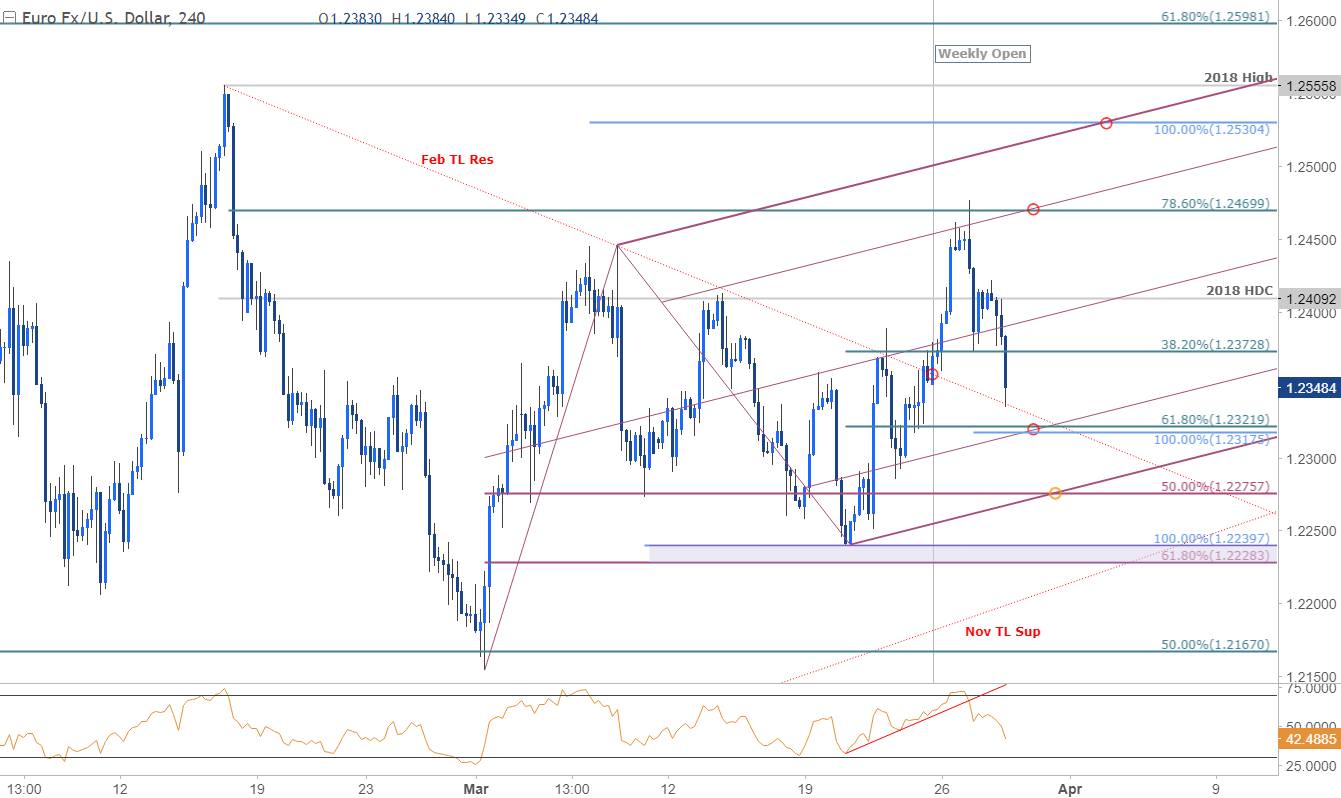
Notes: A few weeks ago we identified a break of near-term uptrend support in EURUSD[6] and kept our focus lower, “targeting the weekly opening-range lows at 1.2291 backed by 1.2265 & 1.2240- both areas of interest for possible exhaustion / long-entries.” Price registered a low at 1.2240 before reversing higher with the pullback now testing the February slope line (resistance) as support. So is that it?
A closer look at near-term price action sees the pair trading within the confines of a modified ascending pitchfork formation[7] extending off the monthly lows. A measured objective of the decline does leave room for a drop lower towards confluence support at 1.2318/22 but intraday losses should be capped by 1.2275(near-term bullish invalidation) IF Euro is still heading higher. I’d still be mindful of resistance at the yearly high-day close at 1.2409 with a breach there putting the 1.2470 & 1.2530 targets back into view.
Why does the average trader lose? Avoid these Mistakes in your trading[8]
Bottom line: We’re looking for exhaustion on this pullback just lower with the decline to offer favorable long-entries. A break below this formation would risk a drop towards 1.2229/40- weakness beyond this level would ultimately look for a test of the monthly lows. From a trading standpoint, I’ll be looking for long-entries on a move towards near-term confluence support. Keep in mind we are heading into the close of the month / quarter this week with Eurozone CPI (Consumer Price Index) & US Core PCE (Personal Consumption Expenditure) on tap ahead of the extended holiday weekend- tread lightly.
For a complete breakdown of Michael’s trading strategy, review
