
- We’re fast approaching the end of Q1 with this holiday-shortened week, with Friday being a market holiday in many economies in observance of Good Friday. As we near the end of the quarter, pressure continue to show across US equities and the US Dollar is exhibiting what appears to be a quarter-end related move as buyers have continued to push-higher after the Monday sell-off in DXY[1].
- This opens a number of interesting scenarios across majors pairs, as a continuation of USD[2] strength will put EUR/USD[3] at an interesting juncture of potential longer-term support, while USD/JPY[4] is rallying towards a key area of potential resistance. We had discussed a number of USD-pairs on yesterday’s webinar, which is available from the following link: US Dollar Rallies to Resistance as Bears Come Back into the S&P[5].
- Are you looking to improve your trading approach? Check out Traits of Successful Traders[6]. And if you’re looking for an introductory primer to the Forex market, check out our New to FX Guide[7].
Do you want to see how retail traders are currently trading the US Dollar? Check out our IG Client Sentiment Indicator[8].
US Equity Slump Continues
The big item over the past 24 hours is another bearish move in US equities[9]. Yesterday’s late-session sell-off reversed the entirety of Monday’s gains, and the sell-off ran all the way until the 76.4% Fibonacci retracement[10] of the February-March move came into play around 2594. This was the same zone of prices that had helped to set support on Friday, which led into the Monday rally[11]. The big question at this point is whether this support can hold as we move towards the end of Q1.
S&P 500 Four-Hour Chart: Fibonacci Support Catches the Lows
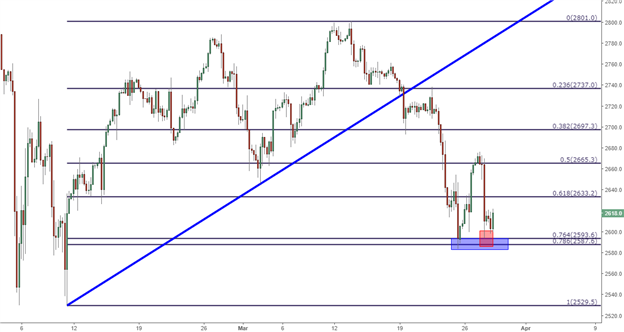
Chart prepared by James Stanley[12]
Facebook Sell-Off Risks Channel Break
The big item in the headline that’s being attributed to this equity sell-off is the carnage that’s been showing in FANG stocks. That’s Facebook, Amazon, Netflix and Google; with the sell-off being led by Facebook around privacy concerns, and this is also hitting Google’s stock as prices have pulled back to test the psychological[13] $1,000 level. This week’s price action[14] has brought a rather aggressive bearish response, and at this point FB is risking a close below a trend-line that’s never been broken. This can be found by connecting the August 2015 low to the January 2017 low. This trend-line runs parallel to a couple of others that help to compose a channel, but with Facebook’s down-side break, if confirmed by a weekly close below this area - the door is opened to considerably more selling.
