
The Japanese Yen[1] has pared some of its recent gains with USD/JPY now probing initial resistance on this rebound. The question remains on whether a low is in after price reversed off a cleared measured objective this week- the focus is on possible failure just higher with the pullback to offer clarity on whether this advance is a correction or a larger shift in trend.
USD/JPY Daily Price Chart
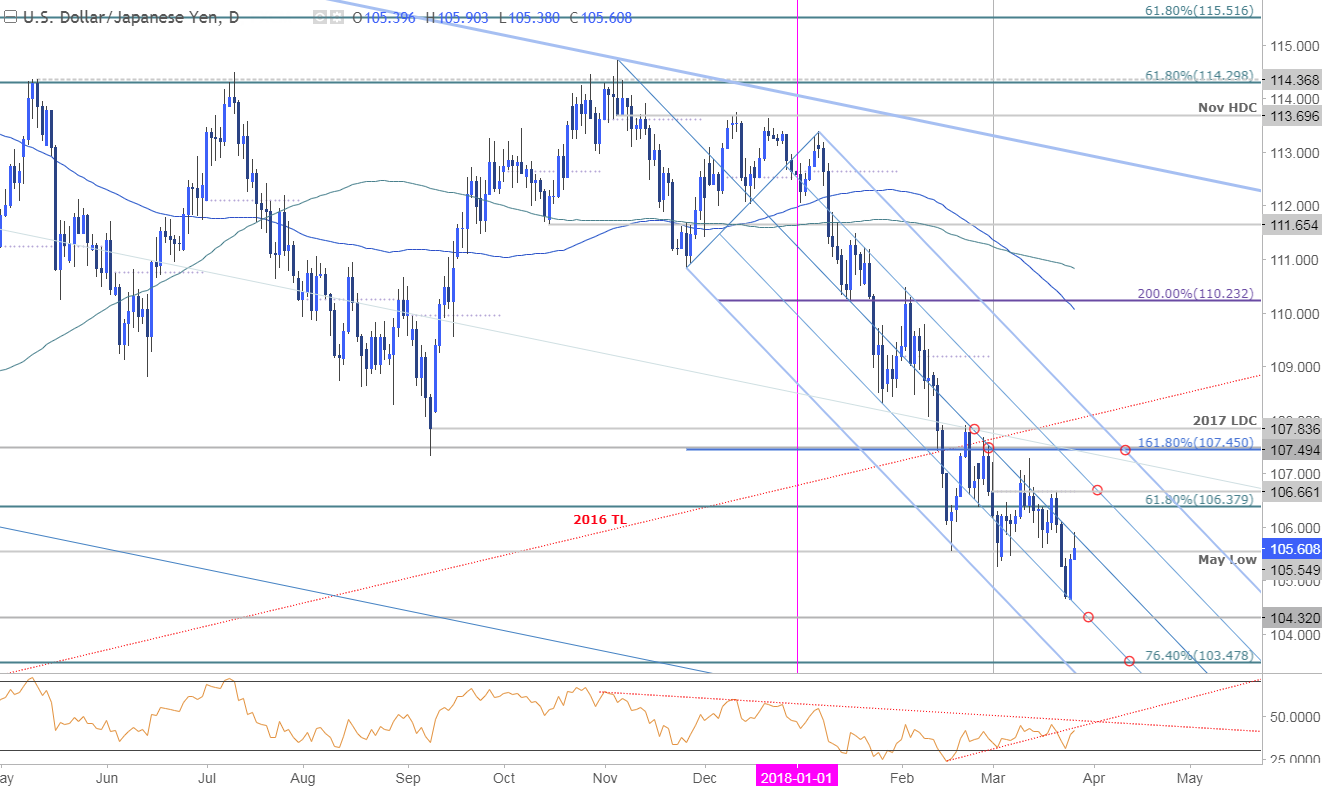
Technical Outlook: In this week’s Technical Perspective[2], we highlighted that, “The Japanese Yen may be poised for further strength (USD/JPY lower) after breaking below slope support (red) last week. Note that momentum does look a bit tired here and the possibility for a near-term recovery remains- that said, look for resistance ahead of last week’s high / the March open at 106.64/66.”
Price has been trading within the confines of broad descending pitchfork formation[3] extending off the November highs with price posting an outside-day reversal off the lower 50-line yesterday. The rebound is now testing initial resistance at the median-line and we’re looking for initial exhaustion here. IF price breaches, look for an extended recovery towards 106.38 & 106.66(also areas of interest for entries). Broader bearish invalidation is steady at 107.45/84- a breach there would suggest a more significant low is in place. A break below the weekly open puts the bears back in control targeting confluence support at 104.32 backed by critical long-term support at 103.04/40.
New to Forex[4] Trading? Get started with this Free Beginners Guide[5]
USD/JPY 240min Price Chart
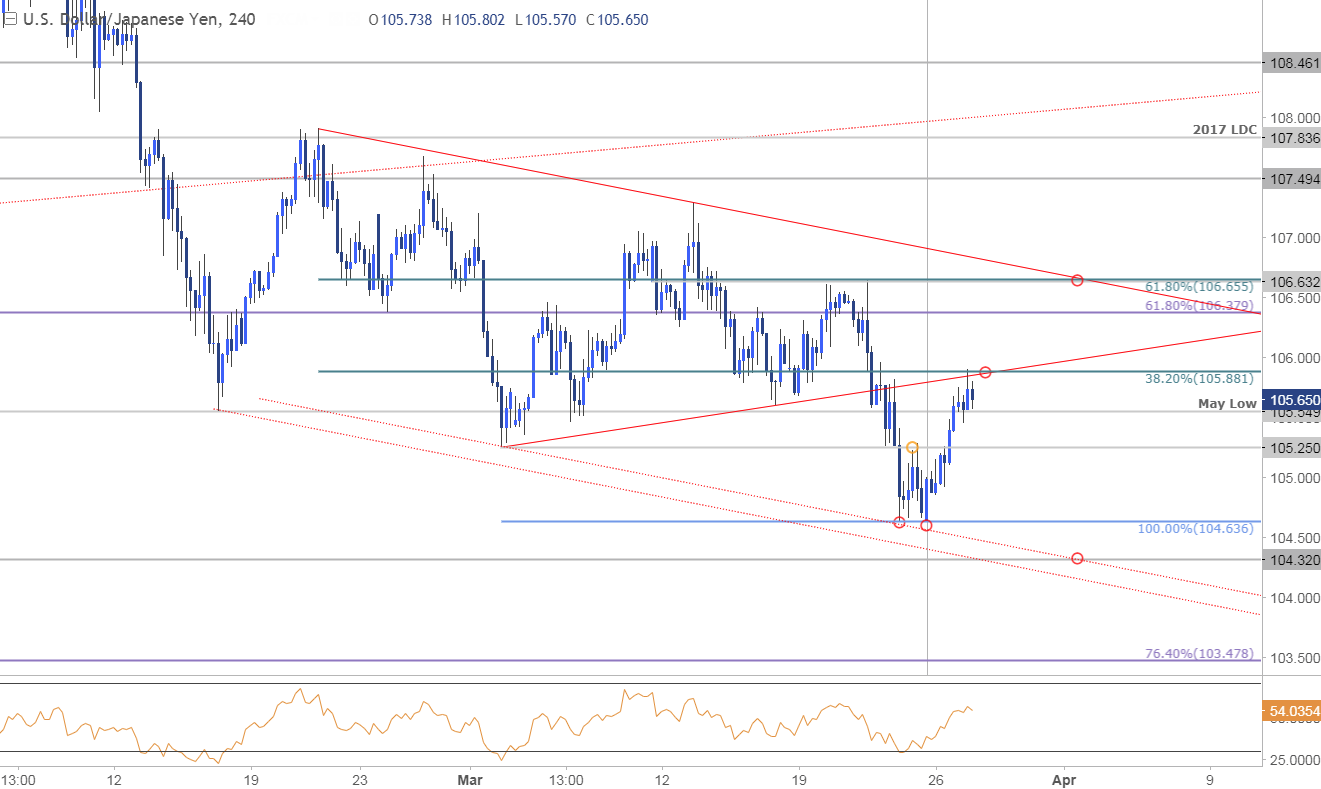
Notes: A closer look at near-term price action further highlights near-term resistance here at 105.88 where the 38.2% retracement converges on former trendline support. Note that momentum[6] has continued to hold sub-60 and we’ll want to see this condition hold for the current short-bias to remain viable. Interim support rests at 105.25 with a break below the 100% extension at 104.64 targeting 104.32 backed by the 103.48.
Why does the average trader lose? Avoid these Mistakes in your trading[7]
Bottom line: We’re looking for signs of exhaustion on this rebound ahead of 106.66 for a pullback. From a trading standpoint, I’d be looking for one more high before things start to turn over. Ultimately, a break below yesterday’s NY low at 104.91 would be need to mark resumption. A turn / rebound ahead of that region would suggest a larger recovery is underway.
For a complete breakdown of Michael’s trading strategy, review his Foundations of Technical Analysis series on Building a Trading Strategy[8]
USD/JPY IG Client Positioning
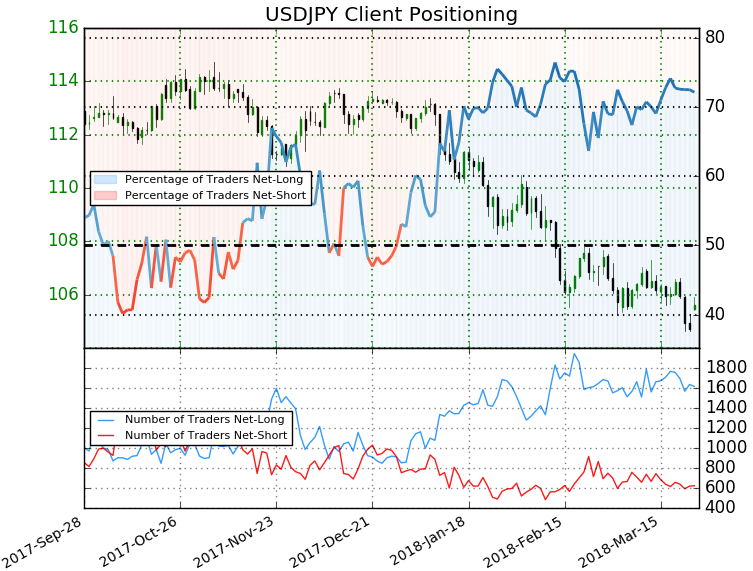
- A summary of
