
Talking Points:
Crude oil prices[1] fall on hopes for US/China trade breakthrough API inventory data eyed as chart setup warns of reversal lower Gold prices[2] may pull back as risk-on mood drives up bond yields Crude oil prices retreated, rebuffing geopolitical risks that helped push them to a two-month high last week. An attack by Iran-backed Houthi forces on Saudi Arabia and the appointment of hawkish former UN ambassador John Bolton as National Security Advisor to President Trump were not enough to amplify supply disruption fears such that they offset overall weakness across the commodities space. Most raw materials prices traded lower amid easing worries about a trade war between the US and China after Treasury Secretary Steven Mnuchin said he was optimistic[3]that a deal can be reached without resorting to tit-for-tat protectionism. The world’s top-two economies form the backbone of a global supply chain formative for broad-based commodities demand. Gold prices enjoyed a lift however, leveraging its appeal as an anti-fiat alternative to rise at the expense of the weaker US Dollar. The greenback suffered even as front-end Treasury bond yields recovered and the priced-in rate hike outlook implied in Fed Funds futures steepened amid a recovery in risk appetite.The return of the “central bank catch-up” narrative[4] might have accounted for the move. The yellow metal may struggle for upside follow-through from here if risk appetite continues to improve, with rising bond yields driving capital away from non-interest-bearing assets. Rising FTSE 100[5] and S&P 500[6] futures warn of just such an outcome. Meanwhile, oil prices will be eyeing API inventory flow data. It will be judged against bets on a 2.28 million barrel outflow to be reported by the EIA on Wednesday. See our free guide to learn what are the long-term forces driving crude oil prices[7]! GOLD TECHNICAL ANALYSIS Gold prices are pushing up against resistance capping gains since late January, now in the 1352.40-54.43 area (trend line, 38.2%Fibonacci expansion). Breaking that on a daily closing basis exposes the 1366.06-67.67 zone (January 25 high, 50% level). Alternatively, a reversal back below the 23.6% Fib at 1333.51 targets range floor support at 1307.25.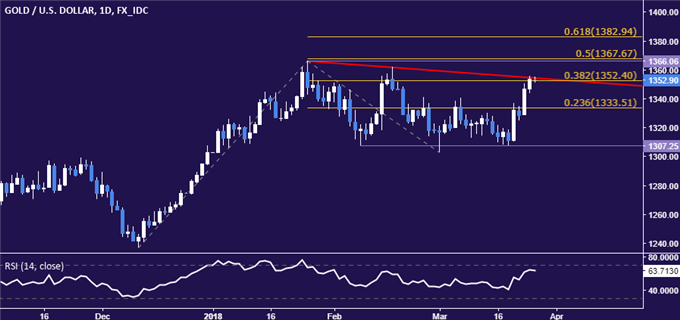 CRUDE OIL TECHNICAL ANALYSIS Crude oil prices are showing negative RSI divergence on a test of resistance in the 66.63-67.49 area (January 25 high, 38.2% Fibonacci expansion), hinting a turn lower may be ahead. A daily close below the 23.6% level at 63.90 opens the door for a retest of the $60/bbl figure. Alternatively, a push above resistance sees the next upside barrier at 70.38, the 50% Fib.
 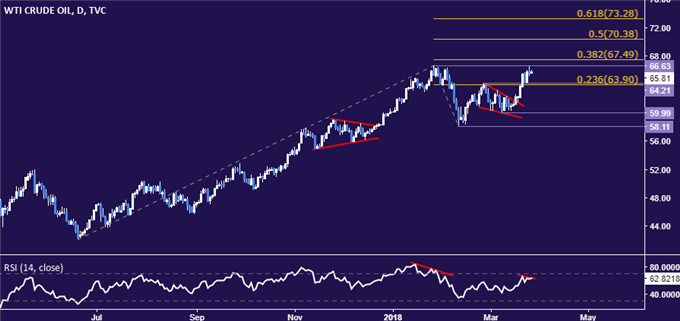 COMMODITY TRADING RESOURCES --- Written
