
The Swiss Franc[1] has been under pressure since early February with USD/CHF climbing to two-month highs ahead of yesterday’s FOMC[2] interest rate decision. The subsequent reversal has broken below the weekly opening-range lows and we’re looking for a break of near-term uptrend support to suggest that a more significant exhaustion high may be in place.
USD/CHF Daily Price Chart
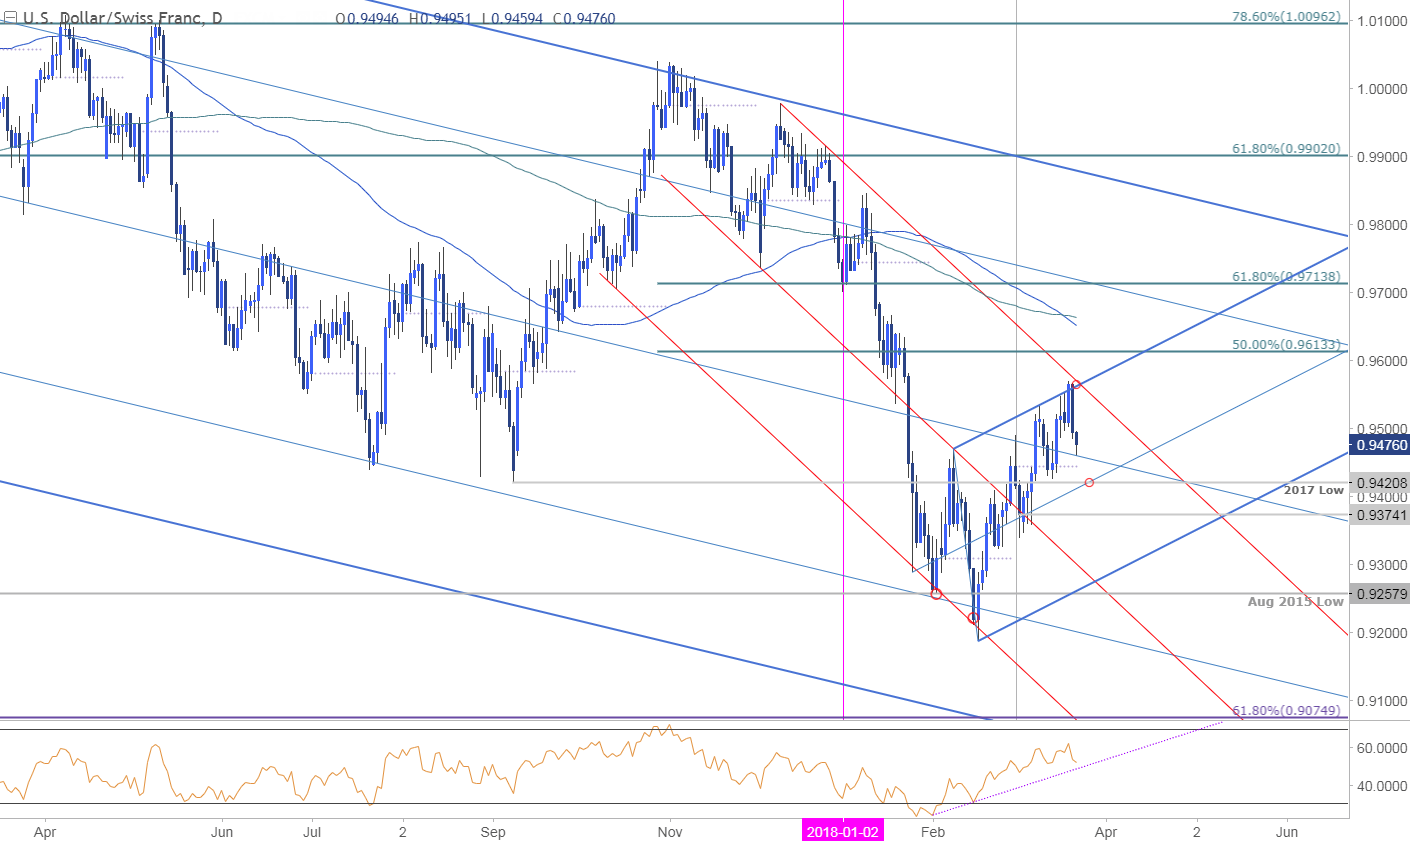
Technical Outlook: USD/CHF has been trading within the confines of a broad descending pitchfork formation[3] extending off the 2015 & 2017 highs with an embedded channel formation off the December highs (red) continuing to govern price action. The pair turned just ahead of channel resistance this week with the pullback now testing support at the median-line of the broader structure. Note that daily RSI failed to breach above the 60-threshold with a pending support trigger now in view.
A close below the March open at 9445 would be needed to suggest that a more significant high is in place with such a scenario targeting the 2017 lows at 9420 and the monthly opening range[4] low at 9338. A topside breach of this slope would be needed to keep the long-bias in play targeting 9614 and the 100 & 200 DMAs at 9550/61.
New to Forex[5] Trading? Get started with this Free Beginners Guide[6]
USD/CHF 240min Price Chart

Notes: A closer look at Swissie price action shows the pair trading within a near-term ascending pitchfork formation extending off the February lows with price now testing the confluence of the 61.8% line and the February highs at 9470. Look for initial resistance at the weekly open at 9524 with our bearish invalidation level set to the weekly high at 9569. The lower parallel rests with the Monthly open at 9445 and a break below this level is needed to fuel the next leg lower targeting 9424, 9378 and 9333.
Why does the average trader lose? Avoid these Mistakes in your trading[7]
Bottom line: The broader advance off the February low is at risk near-term while below basic channel resistance. From a trading standpoint, I’ll favor selling rallies while below the weekly open with a break below this formation needed to validate the reversal. Look for a resistance hold at 60 in intraday RSI[8] with a break sub-40 to offer further conviction on a shift in the momentum profile.
For a complete breakdown of Michael’s trading strategy, review his Foundations of Technical Analysis series on Building a Trading Strategy[9]
USD/CHF IG Client Sentiment
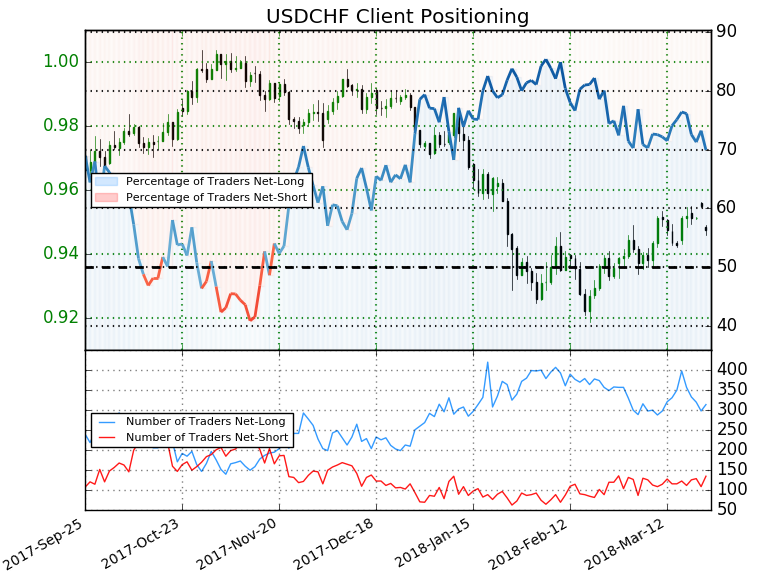
- A summary of IG Client Sentiment[10] shows traders are net-long
