
Cryptocurrencies have been in free fall for the past few days with the recent sell-off in prices taking the crypto-bloc towards the yearly lows. Here are the levels to know in Bitcoin[1], Ethereum and Ripple as prices approach critical make-or-break support thresholds.
Bitcoin Daily Price Chart (Log)
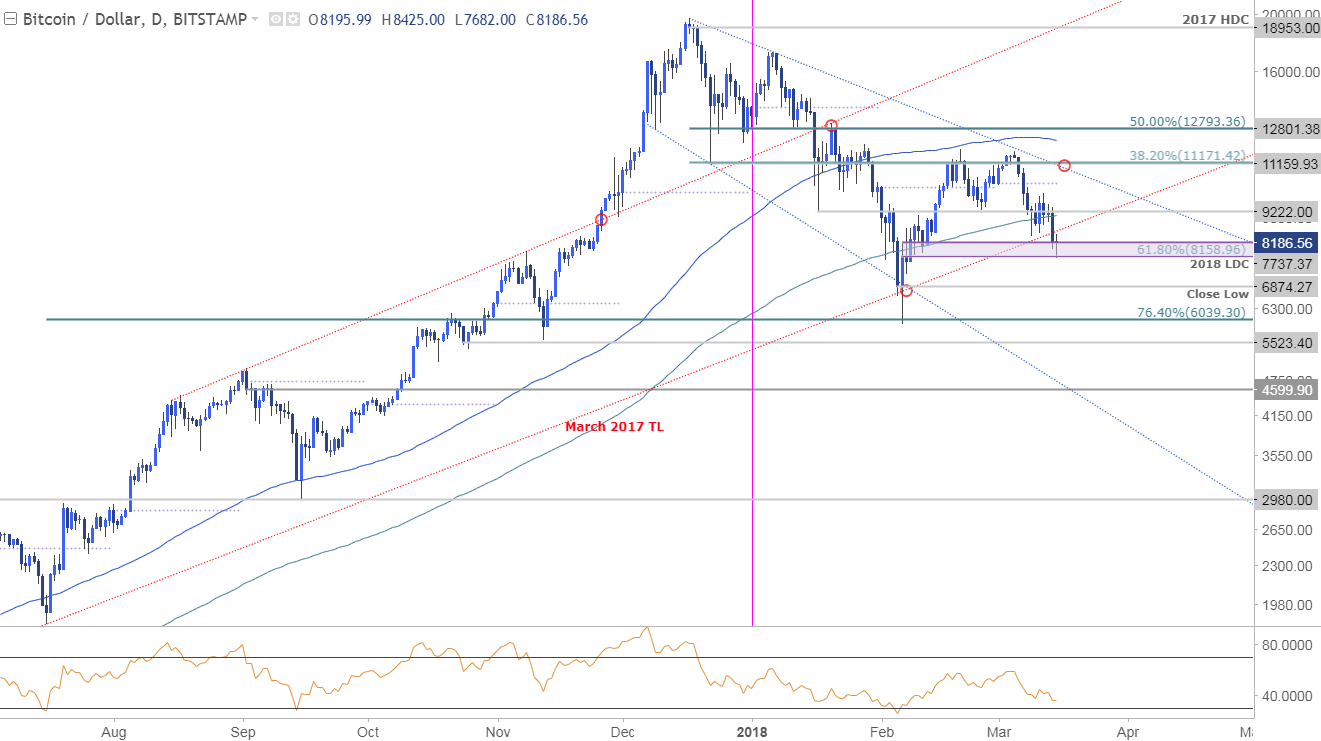
Notes: Earlier this month we noted that, “The risk remains lower while below 11171[2] with basic trendline resistance extending off the record highs further highlighting this region. Interim support remains steady at 9222 with a break lower targeting the 200-day moving average at ~8915 and 8159 where the 61.8% retracement converges on the March 2017 trendline support.” Prices are testing this region now with today’s swing low reversing sharply off 2018 low-day close at 7737 (low registered at 7682) - It’s make-or-break here for the cryptocurrency near-term.
Note that daily RSI turned ahead of the 60-threshold for the past two months with this decline taking the momentum signature back below 40. The current momentum profile continues to highlight the downside risk for prices.
Bottom Line: Bitcoin prices are testing major support- look for a reaction here with a weekly close below risking substantial losses for the cryptocurrency towards support targets at the yearly close-low at 6874 and 6039. Interim resistance now stands at 9222 with a breach above 11171 still needed to mark resumption of the broader uptrend.
New to Bitcoin Trading? Get started with this Free Beginners Guide[3]
Bitcoin IG Client Positioning
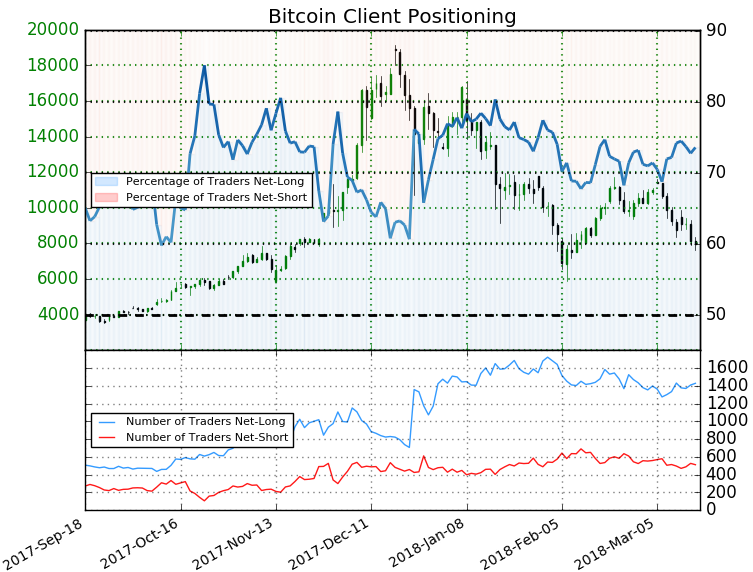
- A summary of IG Client Sentiment[4]shows traders are net-long Bitcoin- the ratio stands at +2.79 (73.6% of traders are long) – bearishreading
- Long positions are 3.3% higher than yesterday and 8.6% higher from last week
- Short positions are 3.4% lower than yesterday and 1.3% lower from last week
- We typically take a contrarian view to crowd sentiment, and the fact traders are net-long suggests Bitcoin prices may continue to fall. Traders are further net-long than yesterday and last week, and the combination of current sentiment and recent changes gives us a stronger Bitcoin-bearish contrarian trading bias from a sentiment standpoint.
Check out our New 2018 trade projectionsin our Free DailyFX Trading Forecasts[5]
Ether Daily Price Chart (Log)
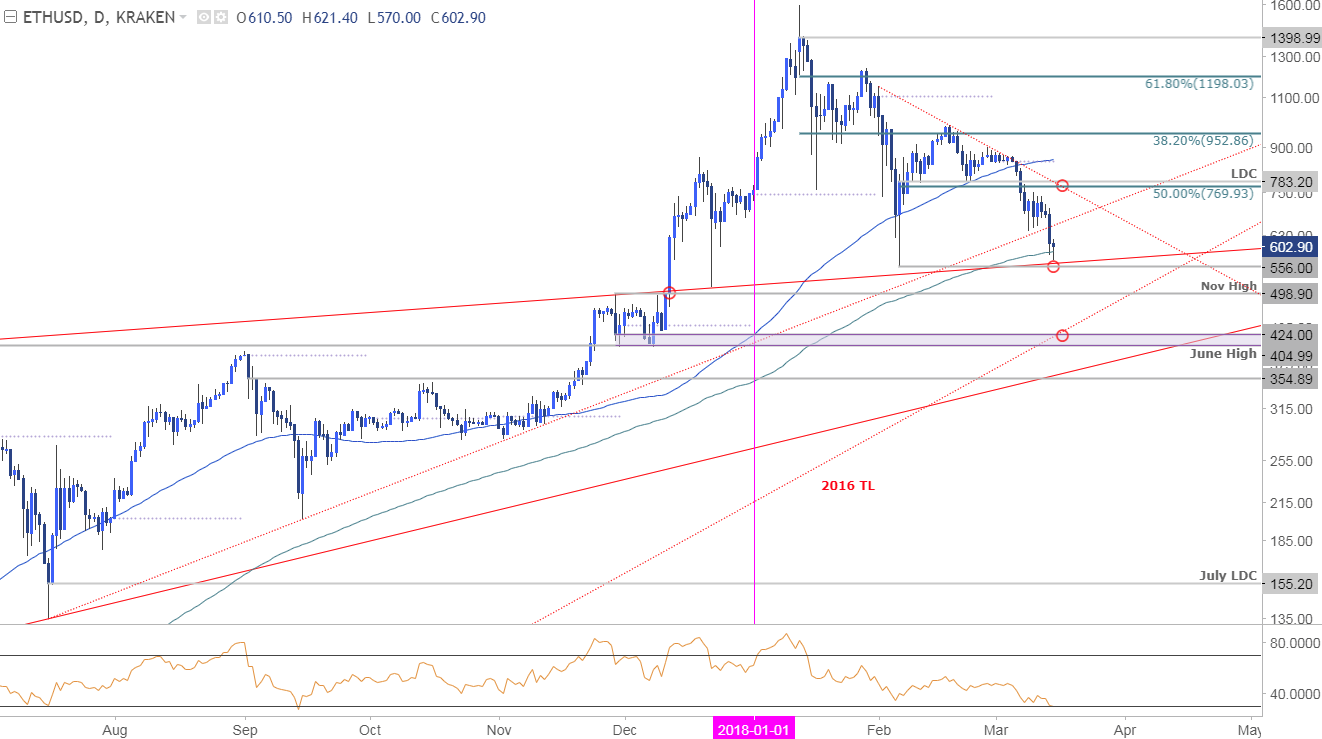
Notes: In my previous Cryptocurrency Technical Outlook[6] I noted that, “Ethereum prices have continued to consolidate just below basic trendline resistance extending off the February highs. Key near-term support is eyed at 7670/83 where the yearly low-day close converges on the 50% retracement of the rally off the lows.” Ethereum prices broke below this threshold less than a week later with the
