
Talking Points:
- Gold prices[1] mark time, torn between conflicting catalysts
- Crude oil prices[2] erase sentiment-linked drop on EIA data
- Monthly IEA report headlines otherwise muted calendar
Gold prices were little-changed yesterday, mirroring inconclusive performance from the US Dollar[3]. Both were pulled in opposite directions by dovish ECB comments[4] and fresh trade war jitters. A drop in EUR/USD[5] echoed as broadly positive for the greenback, hurting the yellow metal. Protectionist saber-rattling from the White House and threats of a “firm…and proportionate” response from the EU soured investors’ mood however. That pushed bond yields downward, improving the relative appeal of non-interest-bearing assets.
Crude oil prices initially fell in with broad-based risk appetite trends, dropping alongside the bellwether S&P 500[6] stock index. Prices recovered most lost ground into the end of the day however as sentiment stabilized and markets took stock of EIA data showing a dramatic build in gasoline and distillate inventories. They added a combined 10.6 million barrels last week, dwarfing forecasts tenfold and overwhelming a larger-than-expected crude storage gain of 5.02 million barrels.
Looking ahead, the monthly IEA Oil Market Report amounts the only bit of eye-catching scheduled event risk. As ever, traders will be looking to gauge whether swelling US supply is expected to be met with growing demand. Absent that, worries about persisting oversupply might weigh on the WTI and Brent benchmarks alike. Otherwise, the absence a clear-cut focal point for speculation might make for a consolidative tone. It may likewise make for greater sensitivity to stray headline risk however.
Learn what retail traders’ gold buy and sell bets[7] say about the price trend!
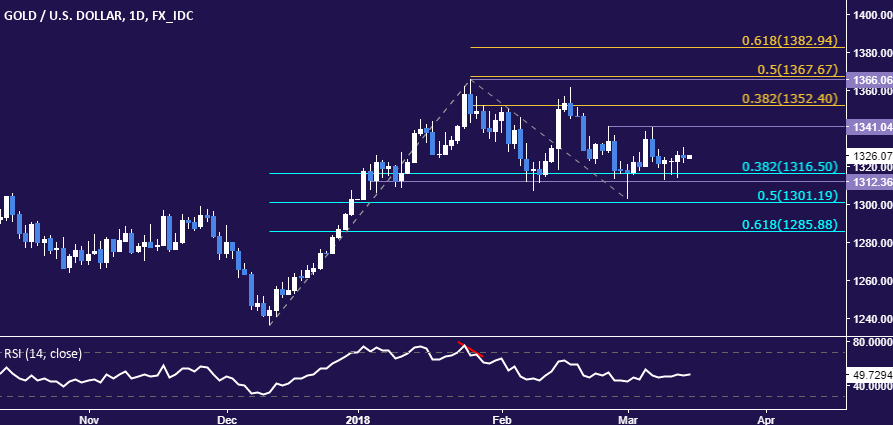
GOLD TECHNICAL ANALYSIS
Gold prices are struggling to resolve direction, drifting sideways along support in the 1312.36-16.50 area (range floor, 38.2% Fib retracement). A break below this barrier initially targets the 50% level at 1301.19. Alternatively, a move higher that clears range resistance at 1341.04 sees the next upside barrier marked by the 38.2% Fib expansion at 1352.40.
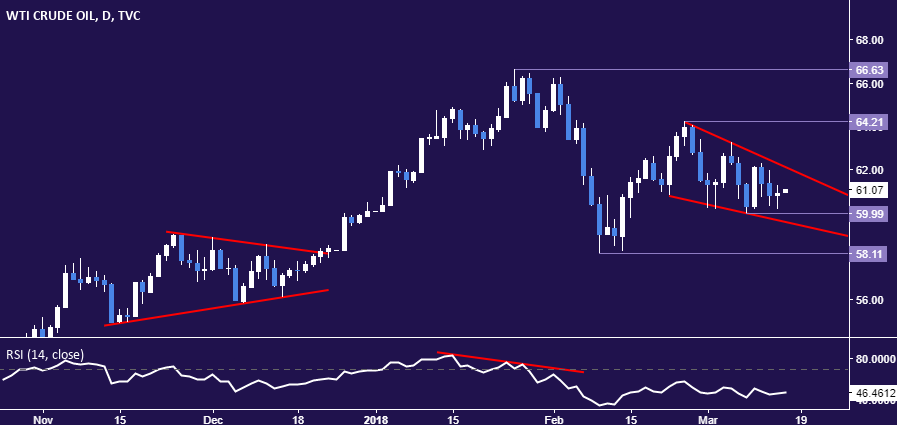
CRUDE OIL TECHNICAL ANALYSIS
Crude oil prices are coiling up within a Falling Wedge chart formation. The setup usually carries bullish connotation, but confirmation is needed on a daily close above the pattern’s upper boundary at 62.11. That would initially expose the February 26 high at 64.21. Alternatively, a drop below support in the 59.59-60.00 area (wedge floor, March 8 low) paves the way for another test of the February 9 bottom at 58.11.
COMMODITY TRADING RESOURCES
--- Written by Ilya Spivak, Currency Strategist for DailyFX.com
To contact Ilya, use the comments section below or @IlyaSpivak[8] on Twitter
To receive Ilya's analysis directly via email, please SIGN UP HERE[9]
