
EURAUD reversed off a critical resistance range last week and we’ve been tracking the pullback in price as the pair approaches interim support at the 2017 high-day close. The pair has continued to trade within the weekly opening-range but we’re looking for a possible breakdown lower before resumption of the broader up-trend.
EURAUD Daily Price Chart
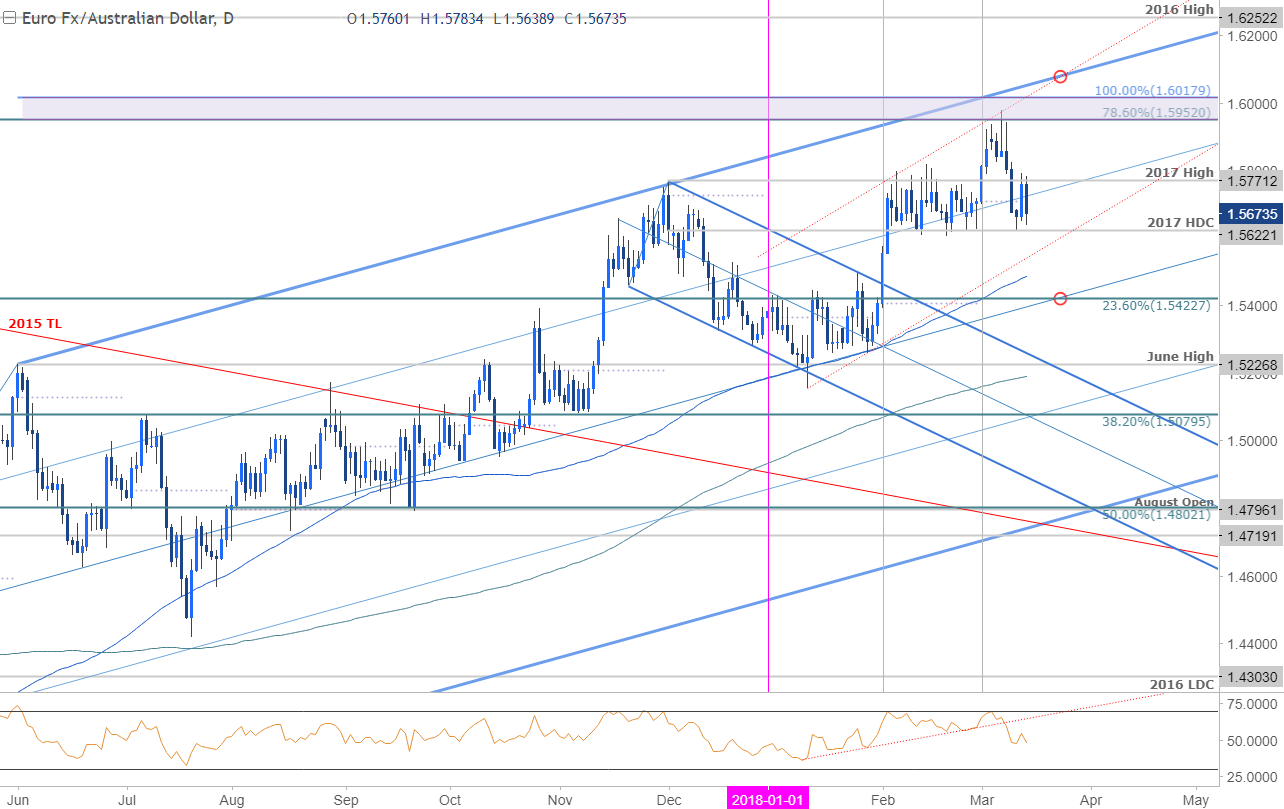
Technical Outlook: In this week’s Technical Perspective[1] I highlighted that EUR/AUD had, “posted a weekly reversal candle last week off critical resistance at 1.5952-1.6018- a region defined by the 78.6% retracement of the 2015 decline & the 100% extension of the 2017 advance and converges on the median-line[2] of a broad ascending pitchfork formation extending off the 2011 & 2012 lows. Divergence in the momentum profile further highlights the threat of a deeper pullback here.”
The sell-off rebounded off interim support at the 2017 high-day close at 1.5622 early in the week with prices turning once again from the 2017 highs at 1.5771 in early Asia trade. The immediate focus is on a break of this near-term range with the risk for a larger correction while below 1.58.
New to Forex[3] Trading? Get started with this Free Beginners Guide[4]
EURAUD 120min Price Chart
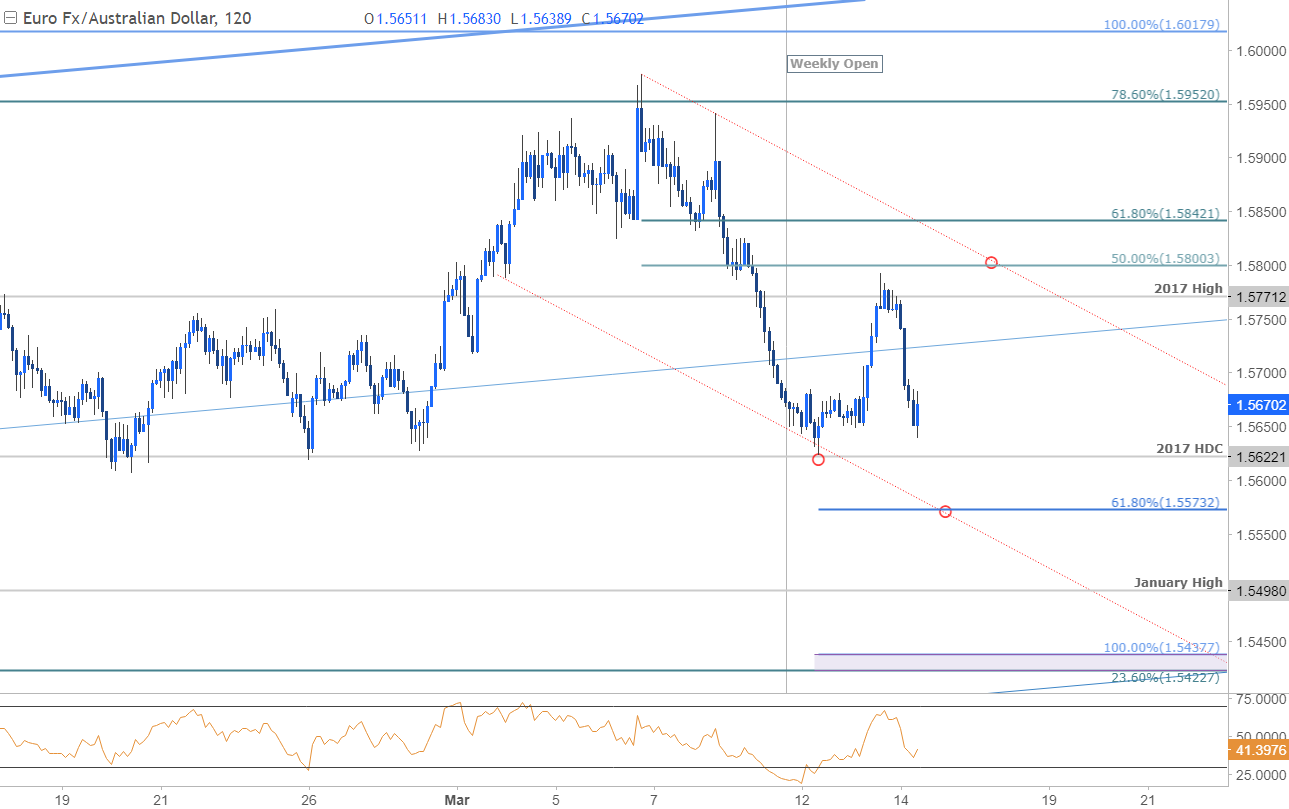
Notes: A closer look at EUR/AUD price action shows the pair trading within the confines of a near-term descending channel formation extending off the monthly highs with the upper parallel[5] highlighting our near-term bearish invalidation level at the 1.58-handle. A break below 1.5622 is needed to validate the broader turn with such a scenario targeting the lower parallel / 61.8% extension at 1.5573 backed by the January high at 1.5498 and the Fibonacci confluence around 1.5423/38.
Why does the average trader lose? Avoid these Mistakes in your trading[6]
Bottom line: EURAUD is has set a well-defined weekly opening-range[7] just above multi-month support. From a trading standpoint, I’ll favor selling strength sub-1.58 targeting a break of this range. Ultimately a break lower would have us looking for more favorable long-entries near broader structural support, currently around ~1.54. A breach above 1.58 invalidates the reversal play with such a scenario targeting key resistance back at 1.5952-1.6018.
For a complete breakdown of Michael’s trading strategy, review his Foundations of Technical Analysis series on Building a Trading Strategy[8]
---
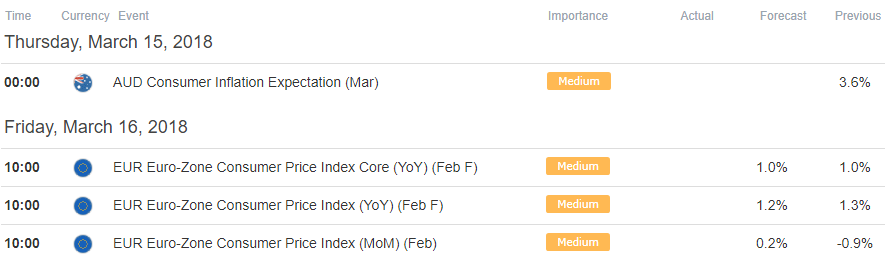
Relevant Data Releases
Other Setups in Play
- Written by Michael Boutros, Currency Strategist with DailyFX
To receive Michael’s analysis directly, please sign-upto his email distribution list[9]
