
Talking Points:
- Interesting patterns of weakness have developed over the past 14 hours, as a rush of Yen-weakness after yesterday’s Tokyo open leads into tonight’s release of BoJ meeting minutes from the bank’s March rate decision. USD/JPY[1] broke above a short-term symmetrical wedge formation, but has since started to pull back as USD-weakness has enveloped the Forex market after this morning’s US CPI print.
- That US CPI print came-in at 2.2% for the sixth consecutive month of inflation at the Fed’s target of 2% or higher. This keeps the Fed in the driver’s seat for a rate hike at next week’s meeting, but USD[2] bulls appear to be unmoved by the prospect as a pronounced move of weakness began to show after this morning’s CPI data. This morning’s price action[3] may also help to show what’s driving the Dollar, as a bullish response did not show after CPI; indicating that the fear is an inflation overshoot to the upside that may cause the Fed to hike even-faster.
- Are you looking to improve your trading approach? Check out Traits of Successful Traders[4]. And if you’re looking for an introductory primer to the Forex market, check out our New to FX Guide[5].
If you’re looking for longer-term analysis on US Stocks, the Euro[6] or the U.S. Dollar, click here for our Trading Guides[7].
USD Falls After CPI Prints In-Line at 2.2%
One of the more pertinent items[8] on this week’s calendar[9] was released earlier this morning. US CPI for the month of February came out at .2%, or 2.2% annualized; in-line with expectations and for the sixth consecutive month at the Fed’s 2% target or higher. Despite this continued strength in near-term inflation data, bulls were unable to hold support as another spate of selling enveloped the US Dollar, helping to push most major pairs like EUR/USD[10] and GBP/USD[11] higher. While this morning’s print keeps the Federal Reserve on pace to hike at next week’s meeting, Dollar bulls have been utterly unable to establish anything notable in the realms of strength; and this is pointing to the fact that there’s a bigger theme going on in the backdrop of the US Dollar at the moment[12].
US Dollar via ‘DXY’ Four-Hour Chart: Fall Below 90.00 After CPI Brings Back the Bears
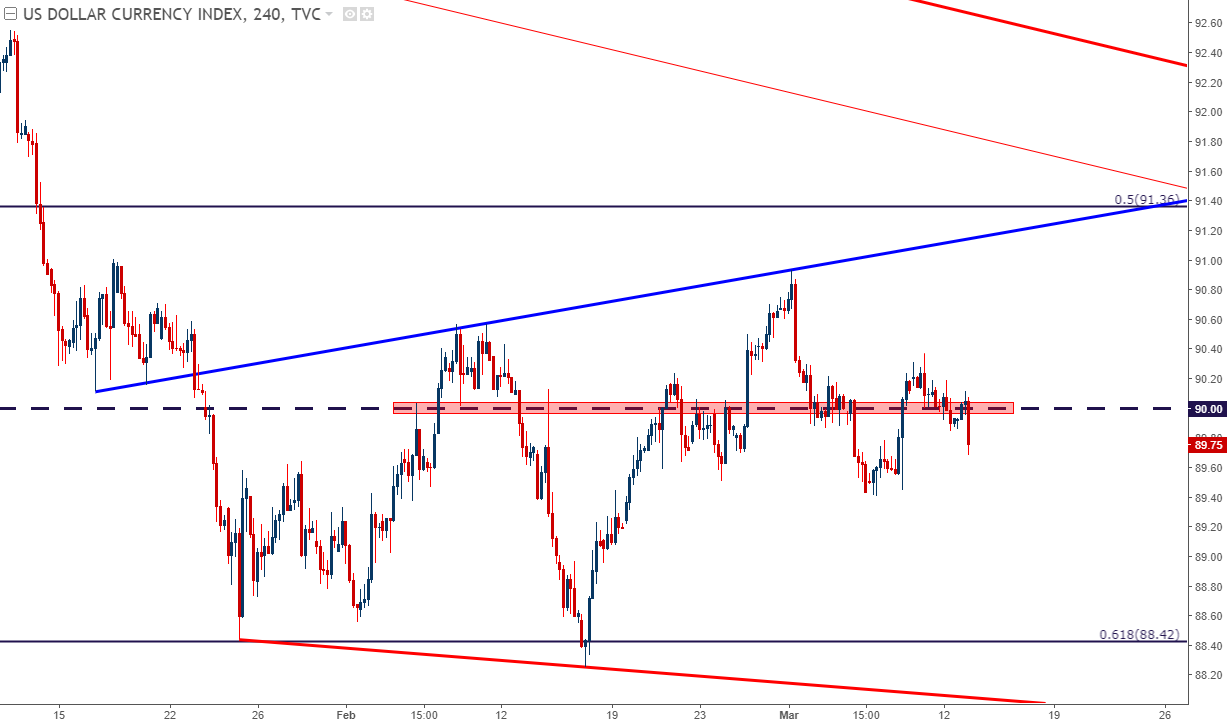
Chart prepared by James Stanley[13]
US inflation data remains on a steady streak that’s now seen six consecutive months at the Fed’s 2% target or higher. This puts the Fed in the driver’s seat for next week’s rate decision, which continues to carry strong probabilities of getting that next rate hike. CME Fedwatch is currently indicating an 86% probability of a
