
Bitcoin prices failed to break through the February highs with the breakdown now risking a deeper correction in the cryptocurrency. It’s important to note that the entire decline off the 2017 highs remains within the confines of the broader uptrend and although prices remain vulnerable for further losses near-term, the sell-off should ultimately offer more favorable long-entries.
Bitcoin Daily Price Chart (Log)
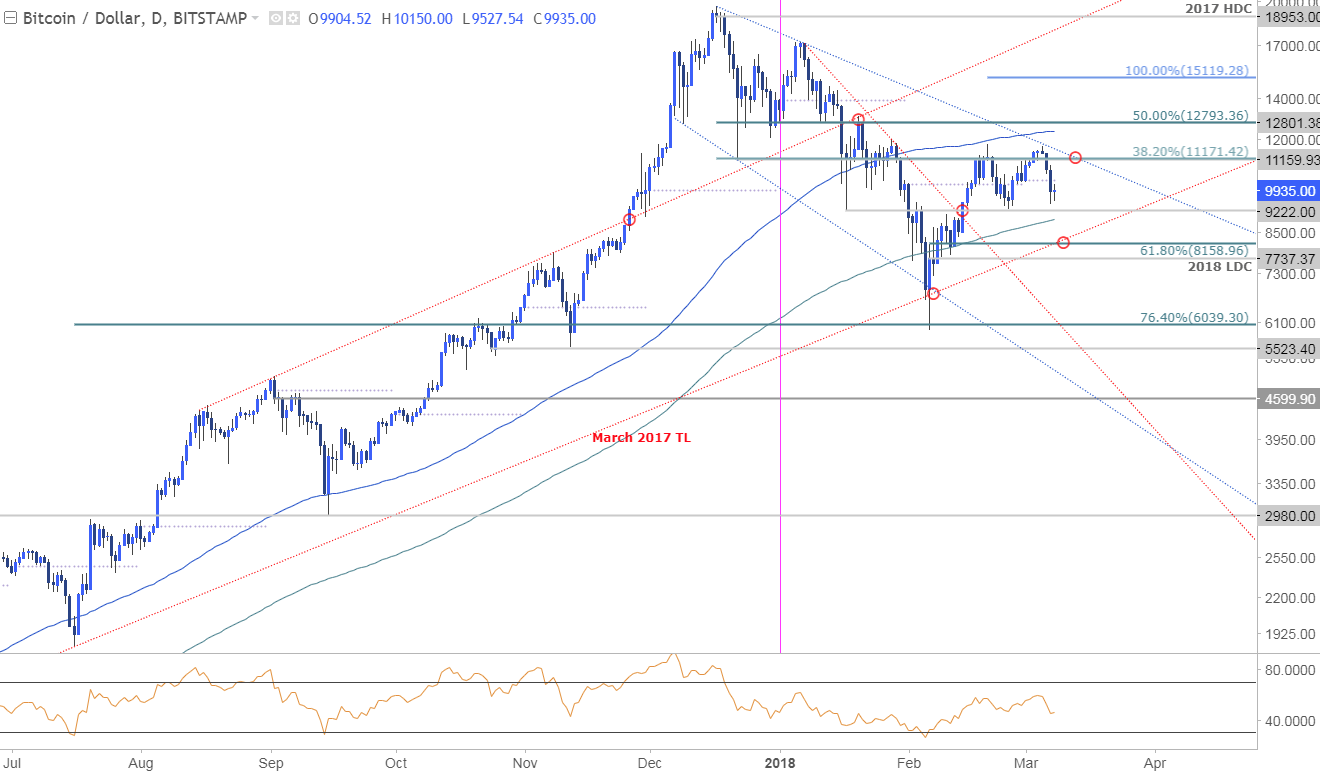
Technical Outlook: In last week’s Cryptocurrency Technical Outlook[1] we highlighted that prices were, “trading with a well-defined range between the January low at 9222 and 11160/71 where the December low converge on the 38.2% retracement of the decline off the record highs. The immediate focus heading into March trade is on a break of this range. Note that the RSI has continued to hold sub-60 after recovering from oversold conditions with the profile suggesting the risk remains weighted to the downside near-term.”
Prices attempted to break the topside of the range early in the month before reversing back below the monthly open at 10315 (note the Daily RSI reversal again at 60).The risk remains lower while below 11171 with basic trendline resistance[2]extending off the record highs further highlighting this region. Interim support remains steady at 9222 with a break lower targeting the 200-day moving average at ~8915 and 8159 where the 61.8% retracement converges on the March 2017 trendline support.
New to Bitcoin Trading? Get started with this Free Beginners Guide[3]
Bitcoin 120min Price Chart (Log)
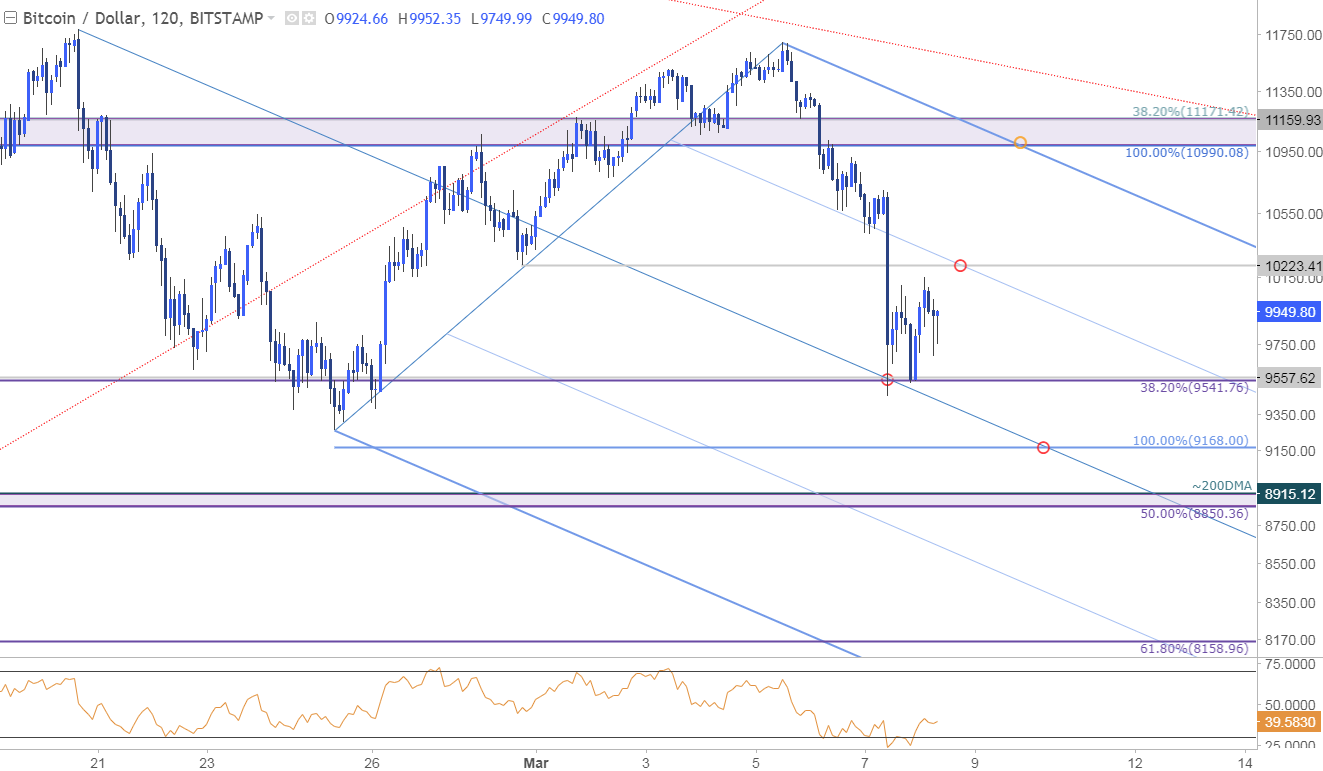
Notes: A closer look at Bitcoin price action highlights a descending pitchfork formation[4] extending off the February / March highs – price rebounded off confluence support yesterday at 9542/58 where the median-line converges on the 38.2% retracement. Look for initial resistance at 10223 with our focus lower while within this near-term formation.
Why does the average trader lose? Avoid these Mistakes in your trading[5]
A break below this threshold targets subsequent support objectives at the 100% extension at 9168 backed by 8850-8915- note that a drop below this level would validate a near-term double-top break with such a scenario risking a sell-off towards initial support targets at 8159.
Bottom line: Bitcoin prices remain at risk for further losses within the confines of the broader uptrend. From a trading standpoint, the immediate risk is lower but the decline should ultimately offer more favorable long-entries near structural support.
For a complete breakdown of Michael’s trading strategy, review his Foundations of Technical Analysis series on Building a Trading Strategy[6].
Bitcoin IG Client Sentiment
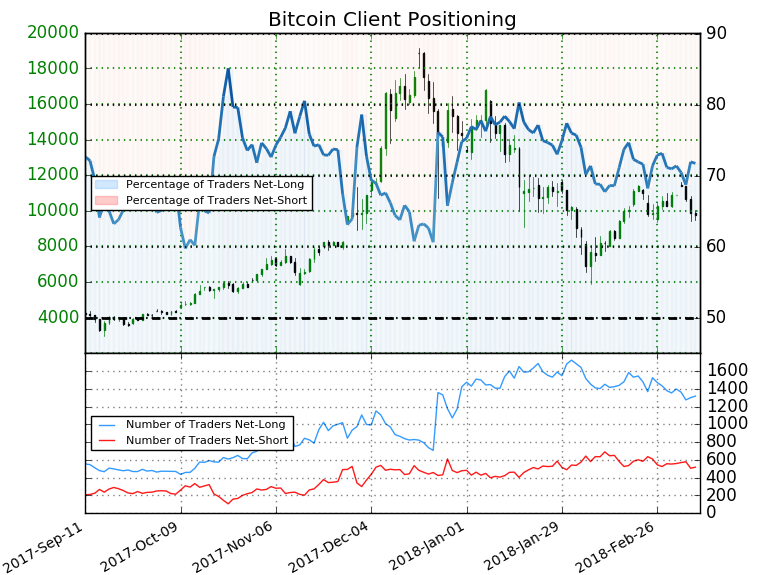
- A summary of IG Client Sentiment[7] shows traders are net-long Bitcoin- the ratio stands at +2.54 (71.8%
