
Talking Points:
- USD[1] weakness continues to drive through most major FX-pairs after last week’s Thursday-turnaround. This continues the Greenback’s year-plus slump that’s seen as much as 15% of its value erased. EUR/USD[2] is continuing the bounce from Fibonacci support last week, and USD/JPY[3] is testing a deeper support level ahead of a key Bank of Japan interest rate decision.
- US equities have seen bids return after last week’s sell-off, with support cauterizing around the 38.2% Fibonacci retracement of the February sell-off. Price action is now making a fast approach towards a prior area of resistance around 2750, which had shown a brief amount of support before last week’s bearish move.
- Are you looking to improve your trading approach? Check out Traits of Successful Traders[4]. And if you’re looking for an introductory primer to the Forex market, check out our New to FX Guide[5].
If you’re looking for longer-term analysis on US Stocks, the Euro[6] or the U.S. Dollar, click here for our Trading Guides[7].
Prevailing Themes of USD Weakness, Equity Strength Come Back
In what’s becoming a more regular occurrence, USD bears have come back[8] while US equities have rallied. Last week produced a spate of strength in the US Dollar that saw DXY[9] make a fast approach towards the 91.00 level; and this also brought pressure into US equities as stocks fell each day Tuesday-Thursday. But Thursday afternoon is around the time that ‘tariff talk’ came into the equation[10], and since then we’ve seen bears come back into the US Dollar while stocks have cauterized some support and moved back towards prior resistance. On the chart below, we’re looking at the S&P 500[11] after last week saw support settle around the 2662 level, which is the 38.2% retracement of the February sell-off in the index and this came into play during last Thursday’s webinar[12]. The next level of resistance resides around 2750, as this was a prior group of swing-highs produced two weeks ago which set around the 61.8% retracement of the same Fibonacci study.
S&P 500 Four-Hour Chart: Fibonacci Support Leads to Bounce From Last Week’s Lows
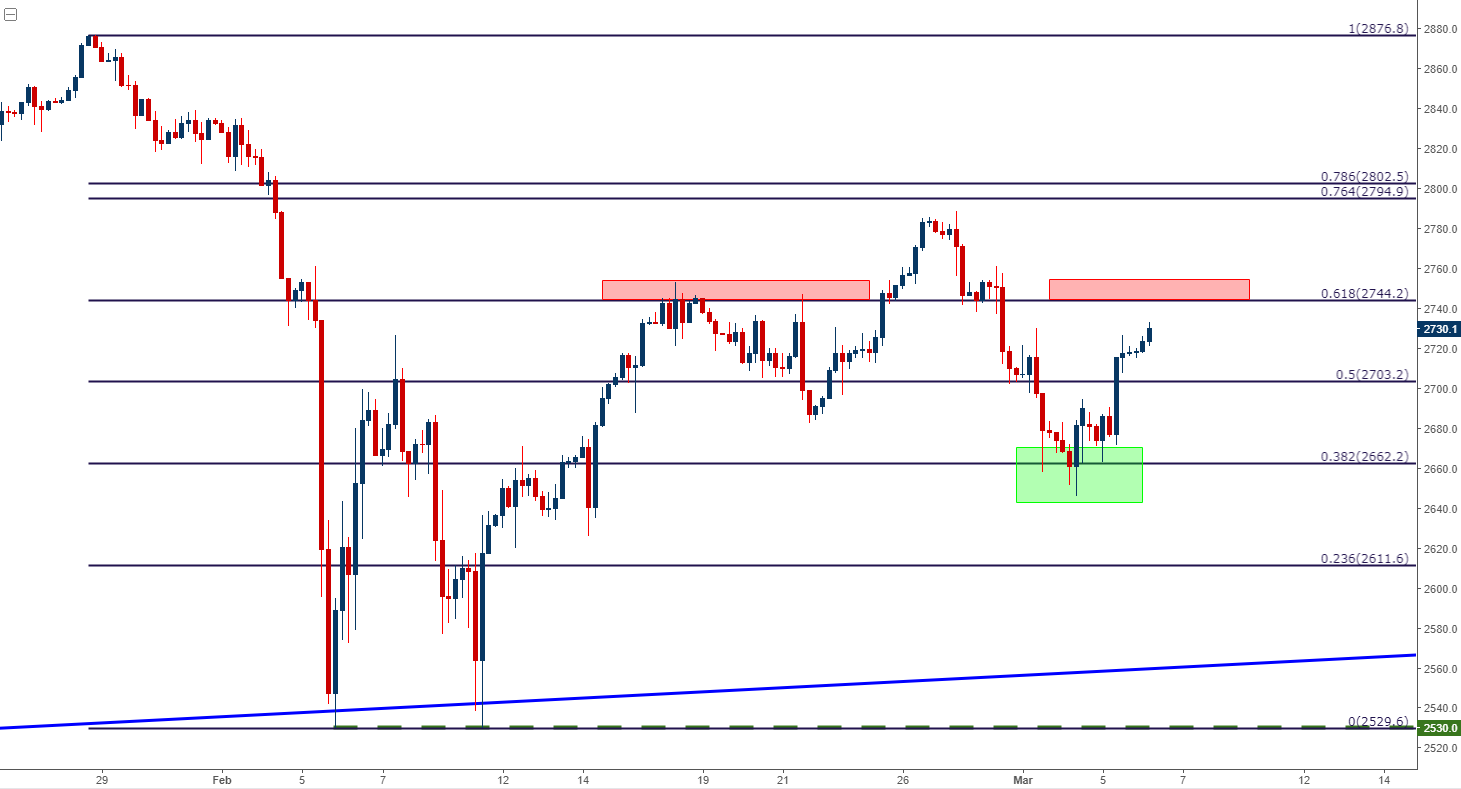
Chart prepared by James Stanley[13]
Dollar Falls, DXY Crosses Back-Below 90.00 Level
In the US Dollar, last week’s strength on the back of Day One of Mr. Powell’s testimony drove DXY back-above the 90.00 level[14]. The Thursday-turnaround on the basis of taper talk saw the move pull back, and support held throughout yesterday as a short-term range had developed. But, even that could not hold as bears came back to push prices right back towards prior support around 89.50. This continues the Greenback’s rough and tumble
