
Talking Points:
Gold price found interim support and are attempting an offensive having touched a two-month low last week. The drop was set off by hawkish comments from Fed Chair Jerome Powell[1] that tarnished the appeal of anti-fiat and non-interest-bearing assets. The move turned as US President Donald Trump unexpectedly hiked tariffs on steel and aluminum, shocking markets[2].
Crude oil prices fell in with broad-based market sentiment trends[3]. Investors’ dour mood – initially spoiled by the prospect of rapid Fed interest rate hikes and then compounded by trade war jitters – familiarly translated into lower stock prices. The risk-geared WTI contract mirrored those moves, tracking the bellwether S&P 500[4] equity index downward.
Concerns about a growth-killing protectionist flare-up and an apparently worrying outcome in Italy’s general election[5] are weighing heavily on risk appetite at the start of the week. Futures tracking European and US equity benchmarks pointing decidedly lower before their corresponding bourses come online. That spells trouble for oil prices, though gold may continue to benefit from traders’ uneasy disposition.
Headlines emerging from the first day of the CERAWeek conference in Houston – including the unveiling of a new IEA five-year oil market forecast – might briefly break the dominance of macro-level themes. February’s non-manufacturing ISM gauge is also on tap, with a slight slowdown in the pace of US service-sector growth expected. Markets may not care about such minutiae for very long however.
See our free guide to learn what are the long-term forces driving crude oil prices[6]!
GOLD TECHNICAL ANALYSIS
Gold prices are attempting to launch a tepid recovery, with prices probing above the resistance line defining the near-term down move from mid-February’s swing high. A daily close above that level – now at 1323.78 – followed by a breach of the 23.6% Fibonacci expansion at 1333.51 exposes the 38.2% threshold at 1352.40. Alternatively, a move below support in the 1312.36-16.50 area targets the 50% Fib retracement at 1301.19.

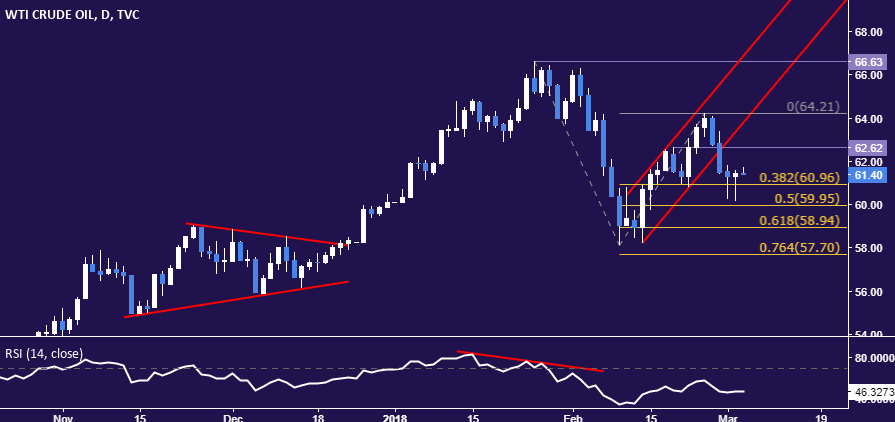
CRUDE OIL TECHNICAL ANALYSIS
Crude oil prices stalled at support marked by the 38.2% Fibonacci expansion at 60.96. A daily close below this barrier exposes the 50% level at 59.95. Alternatively, a move back above the chart inflection point at 62.62 paves the way for a retest of the February 26 high at 64.21.
--- Written by Ilya Spivak, Currency Strategist for DailyFX.com
To contact Ilya, use the comments section below or @IlyaSpivak[7]on Twitter
To receive Ilya's analysis directly via email, please SIGN UP HERE[8]
References
- ^ hawkish comments from Fed Chair Jerome Powell (www.dailyfx.com)
- ^ shocking markets (www.dailyfx.com)
- ^ fell in with broad-based market sentiment trends (www.dailyfx.com)
- ^ S&P 500 (www.dailyfx.com)
- ^ worrying outcome in Italy’s general election (www.dailyfx.com)
- ^ long-term forces driving crude oil prices (www.dailyfx.com)
- ^ @IlyaSpivak (www.twitter.com)
- ^ SIGN UP HERE (forms.aweber.com)
