
Despite a surge in broader market volatility, cryptocurrency have largely remained in consolidation this week with prices trading around key technical levels into the March open. Here are the levels to know in Bitcoin[1], Ethereum, Ripple and Litecoin as we await these pending range-breaks. Is the broader correction in the crypto-bloc over? The technicals suggest we should find out soon – we’re not out of the woods just yet.
Bitcoin Daily Price Chart
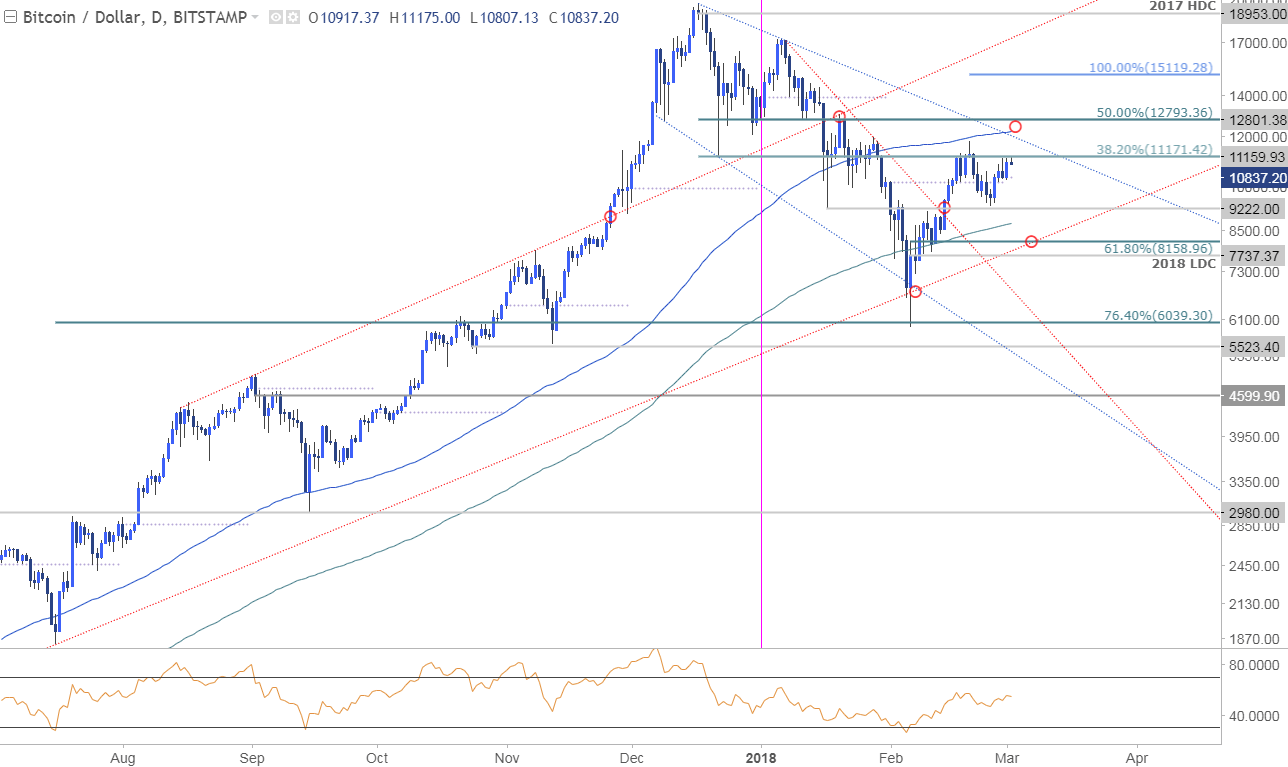
Notes: Bitcoin prices closed February fractionally higher despite the early-month decline with the cryptocurrency trading with a well-defined range between the January lows at 9222 and 11160/71 where the December low converge on the 38.2% retracement of the decline off the record highs. The immediate focus heading into March trade is on a break of this range. Note that the RSI has continued to hold sub-60 after recovering from oversold conditions with the profile suggesting the risk remains weighted to the downside near-term.
Bottom Line: A breach above 12793 would be needed to mark resumption of the broader uptrend with such a scenario targeting a run on the 100% extension at 15119. A downside break risks a drop towards confluence support at 8159 with our broader bullish invalidation level steady at the 2018 low-day close at 7737. From a trading standpoint, I’ll favor buying a dip into structural support OR a break & retest of basic trendline resistance[2] extending off the record highs.
New to Bitcoin Trading? Get started with this Free Beginners Guide[3]
Bitcoin IG Client Positioning
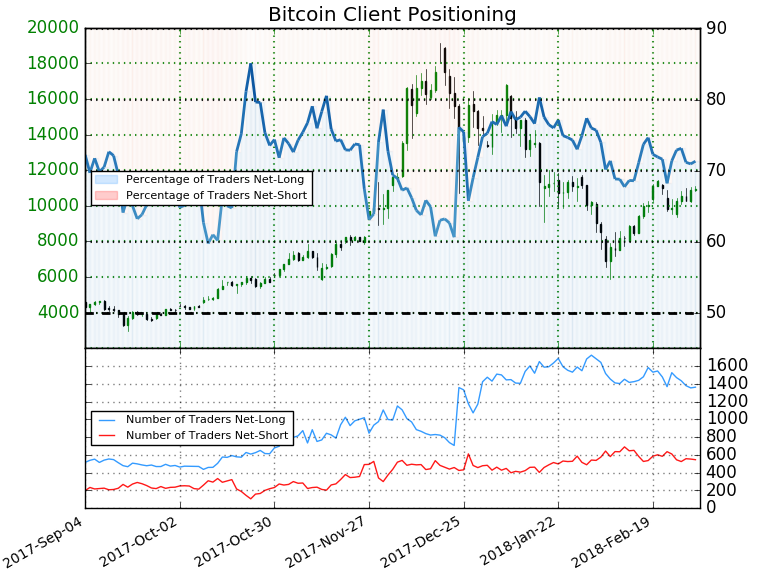
- A summary of IG Client Sentiment[4]shows traders are net-long Bitcoin- the ratio stands at +2.49 (71.4% of traders are long) – bearishreading
- Long positions are 0.6% lower than yesterday and 1.0% lower from last week
- Short positions are 1.6% lower than yesterday and 12.5% lower from last week
- We typically take a contrarian view to crowd sentiment, and the fact traders are net-long suggests Bitcoin prices may continue to fall. Traders are further net-long than yesterday and last week, and the combination of current positioning and recent changes gives us a stronger Bitcoin-bearish contrarian trading bias from a sentiment standpoint.
Check out our New 2018 projectionsin our Free DailyFX Trading Forecasts[5]
Ether Daily Price Chart
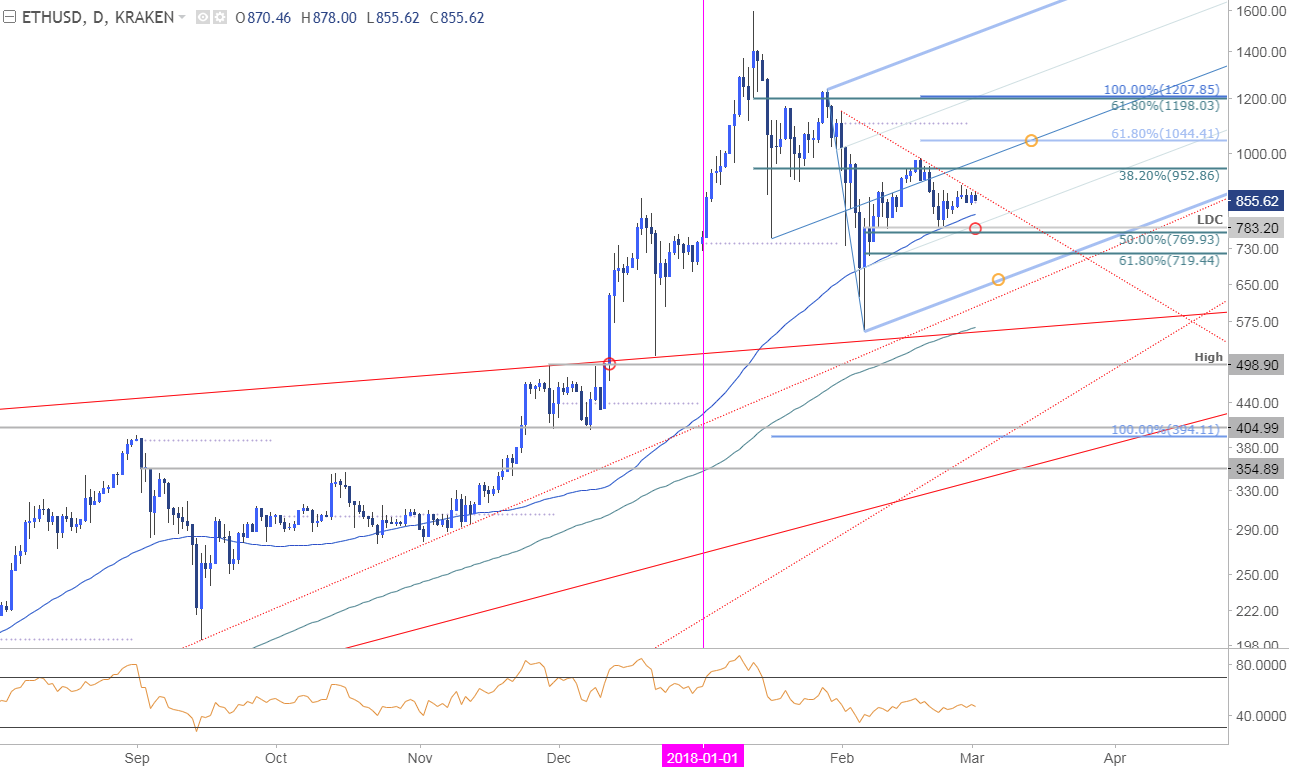
Notes: Ethereum prices have continued to consolidate just below basic trendline resistance extending off the February highs. Key near-term support is eyed at 7670/83 where the yearly low-day close converges on the 50% retracement of the rally off the lows. A break below this threshold would risk a larger set-back towards 719 with our bullish invalidation level set to the lower parallel of the ascending pitchfork formation[6], currently ~650s.
Bottom line: Look for a break of this consolidation range with a breach above the 61.8% extension at 1044 needed to mark resumption of the broader uptrend. Such a scenario would look for an extension into confluence resistance at 1198-1208 backed by the record high-day close at 1399.
Why does the average trader lose? Avoid these Mistakes in your trading[7]
Ripple Daily Price Chart
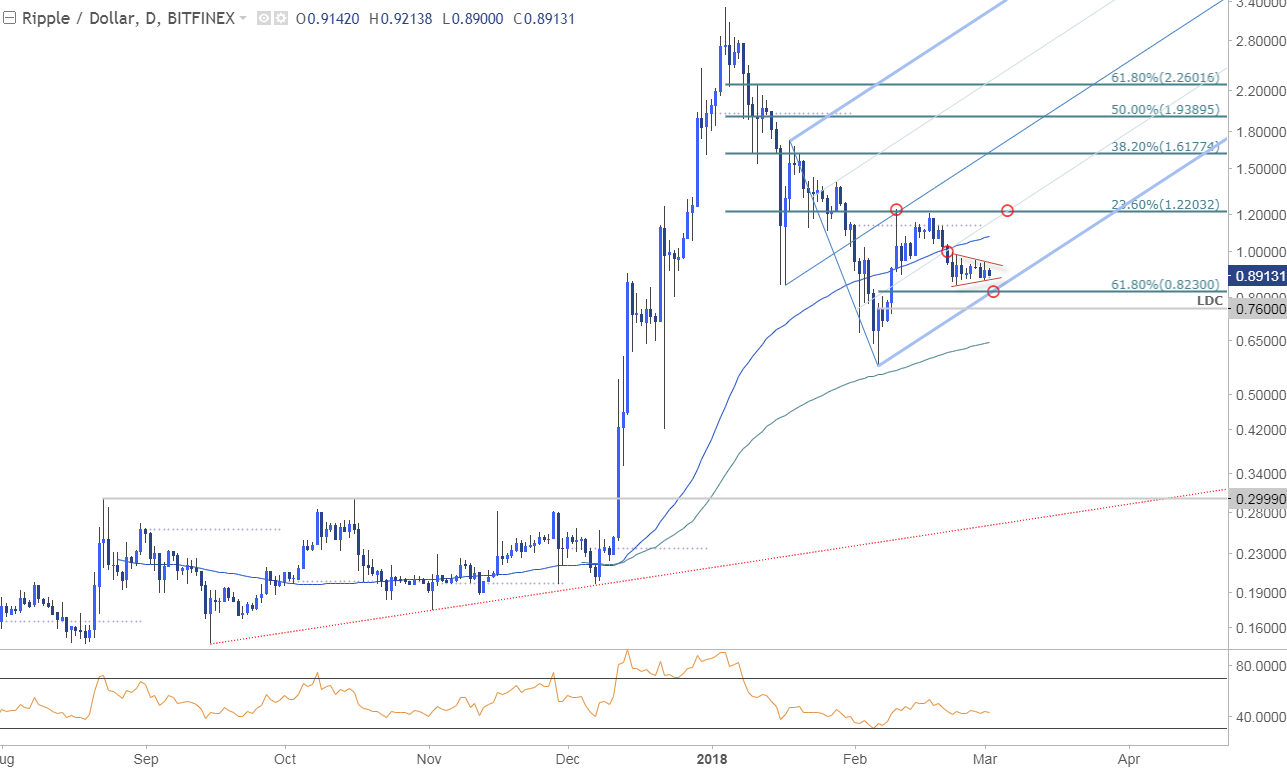
Notes: I highlighted this setup in Ripple earlier this week[8] and the focus remains on this consolidation just above confluence support at 8230. Look for a breakout of this range with our bullish invalidation level steady at the 2018 low-day close at 7600. A topside breach targets a rally towards the 100-day moving average at ~1.0750s backed key near-term confluence resistance at 1.2203- a close above this threshold is needed to mark resumption of the broader uptrend.
Bottom line: I’m on the lookout for a near-term exhaustion low on a downside break of this range with the decline to offer more favorable long-entries near structural support. It’s worth noting that given recent price action, a break below 7600 would likely see accelerated losses for the cryptocurrency with such a scenario risking a drop towards the 200-day moving average at ~6400.
Litecoin Daily Price Chart
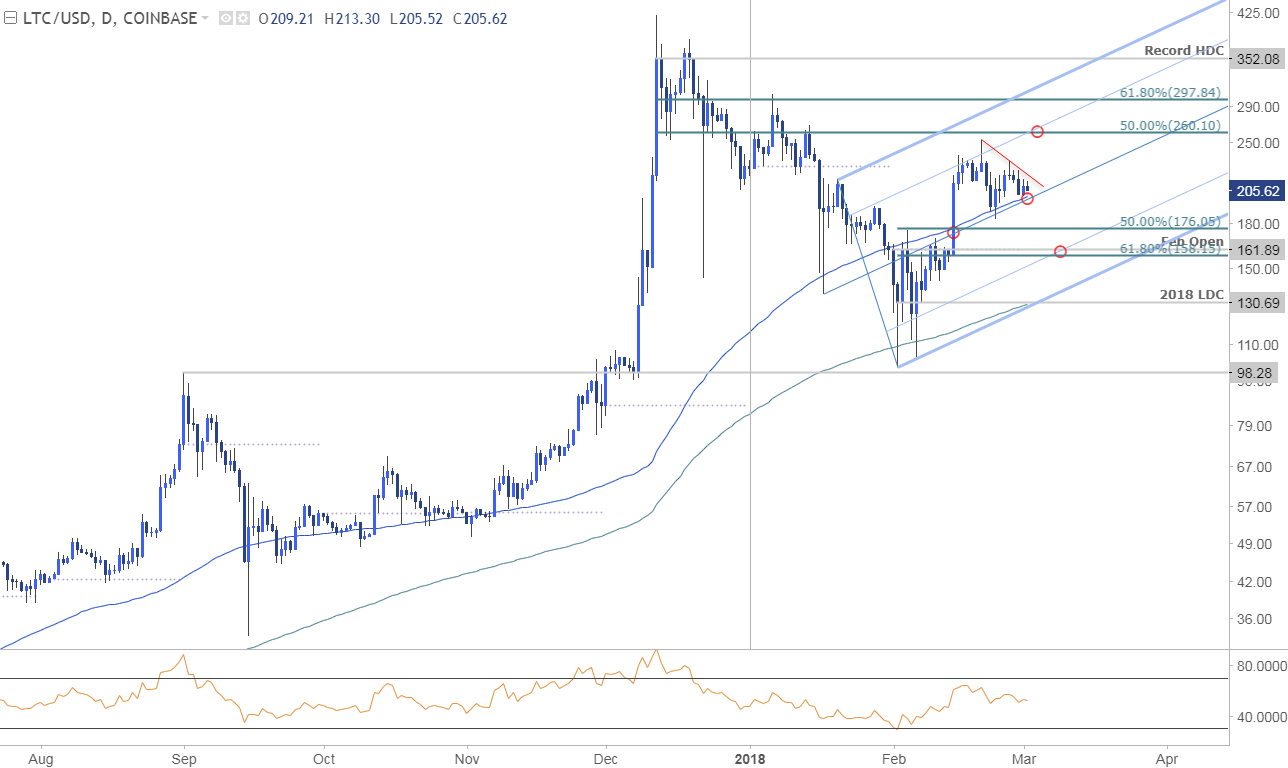
Notes: Litecoin remains in consolidaiton just above confluence support at ~200 where the 100-day moving average converges on the median-line of the ascending picthfork formation. A break below this region would risk a drop towards 176 and confluence support at 158/62 (61.8% retracement, February open and 61.8% slope line)- an area of interest for exhaustion / long-entries IF reached. Broader bullish invalidaiton stands with the 2018 low-day close at 131.
Bottome Line: Prices are apporaching the apex of this consolidation range and we’ll be looking for a break in the days ahead to offer guidance. A topside breach targets confluence resistance at 260 backed closely by 298 and the record high-day close at 352. From at trading standpoint I’ll be looking for possble break lower to offer more favorable long-entires near slope support OR a breach and retest of the Febraury trendline to validate the break higher.
--- Written by Michael Boutros, Technical Currency Strategist with DailyFX
To receive Michael's analysis directly, please subscribe to his email districution list[9]
Follow Michael on Twitter @MBForex[10] or contact him at
References
- ^ Bitcoin (www.dailyfx.com)
- ^ basic trendline resistance (www.dailyfx.com)
- ^ Free Beginners Guide (www.dailyfx.com)
- ^ IG Client Sentiment (www.dailyfx.com)
- ^ Free DailyFX Trading Forecasts (www.dailyfx.com)
- ^ pitchfork formation (www.dailyfx.com)
- ^ Avoid these Mistakes in your trading (www.dailyfx.com)
- ^ setup in Ripple earlier this week (www.dailyfx.com)
- ^ subscribe to his email districution list (forms.aweber.com)
- ^ @MBForex (twitter.com)
