
EUR/USD[1] Price, Chart, and Analysis
- 10-year US Treasury yields touching multi-week highs.
- EUR[2]/USD[3] is likely to re-test 1.1700 in the short-term.
Keep up to date with all market-moving data releases and events by using the DailyFX Calendar[4]
The recent rally in US Treasury yields has not fully fed through into the US dollar[5] with the greenback still lagging other majors. While the sell-off can be seen in other USD-pairs, including USD/CAD[6], EUR/USD has remained in a one big figure trading range over the last week with price action in the last five days confined to a 70 cent range. Indeed the 14-day ATR is trading at a multi-week low of around 42 cents highlighting the lack of volatility in the pair. As US Treasury yields edge higher, the dollar will strengthen against the Euro and the recent tight ranges will likely break to the downside.
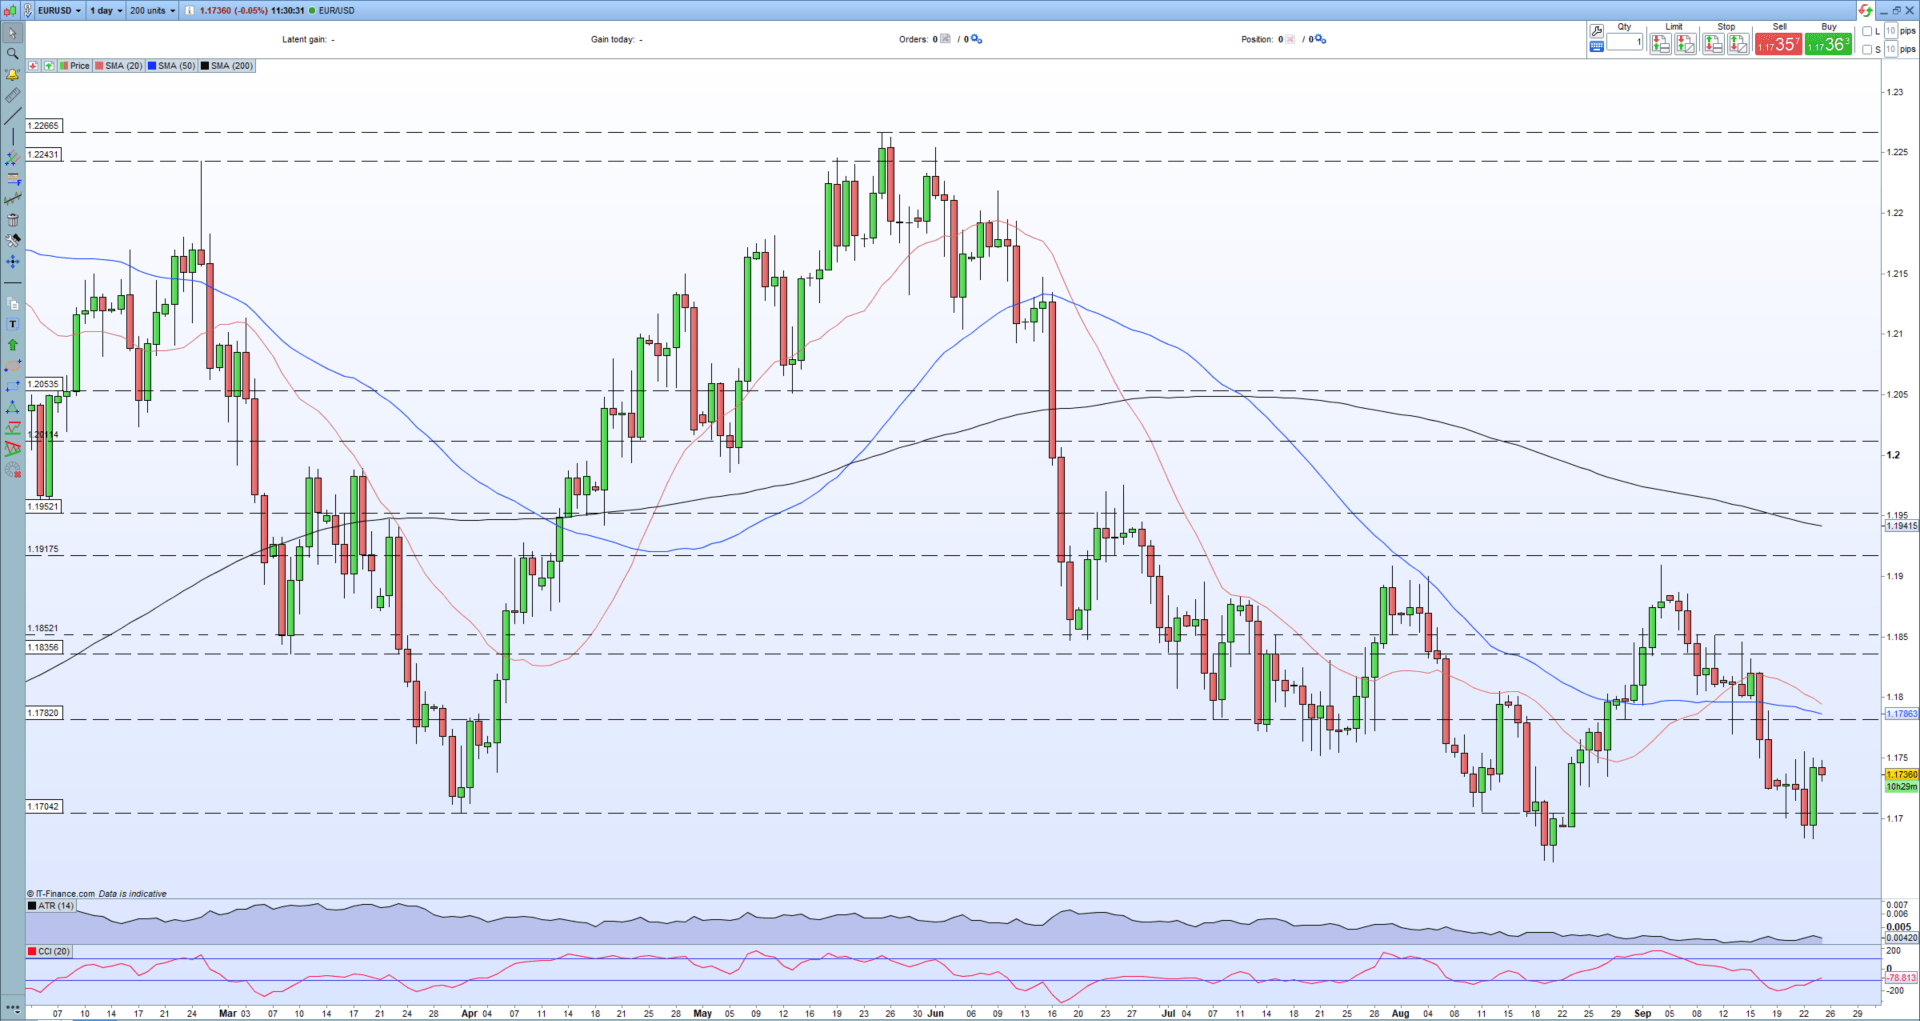
The daily chart highlights the recent weakness in the pair with a couple of double low prints made in lateAugust and earlier this week. Below here we go back to levels last seen in November 2020. For the pair to fully break down, the November 4 low at 1.1604 needs to be broken to continue the pattern of lower highs and lower lows. The pair also trade below all three simple moving averages, a negative technical set-up.
Retail trader data show 57.85% of traders are net-long with the ratio of traders long to short at 1.37 to 1. The number of traders net-long is 3.07% lower than yesterday and 2.68% lower from last week, while the number of traders net-short is 11.94% higher than yesterday and 0.34% higher from last week.
We typically take a contrarian view to crowd
