
Bitcoin (BTC/USD) Price Analysis:
Bitcoin[1]price action[2] currently remains within in a confluent zone, formed between Fibonacci retracement levels of the 2020-2021 move. With the adoption of the major cryptocurrency[3] by PayPal[4] in October last year, demand for virtual currencies soared, resulting in a break of 2017 levels and a series of new highs into 2021 trade. However, as larger institutions continue to investigate the possibility of adopting BTC/USD[5] as an additional payment method, the limited supply of coins in circulation have provided Bitcoin with characteristics akin to Gold[6], Silver[7] and other safe-haven assets[8], gaining popularity as a hedge against inflation and US Dollar[9] weakness.
Bitcoin (BTC/USD) Technical Analysis
Although the beginning of the week looked relatively promising for Bitcoin[10] bulls, risk of more stringent regulations and rising bond yields have hindered further gains, providing bears with an opportunity to push prices lower. Since reaching a new high on 21 February 2021, upward momentum faltered, resulting in a depreciation of approximately $10,000 over the next two weeks. Now, although bulls are eager to regain control of the trend, bears are persistent to break below current support, formed by the 23.6% Fibonacci retracement[11] level of the 2020 – 2021 move, at $45,463. For now, the Commodity Channel Index (CCI)[12] and the Moving Average Convergence/Divergence (MACD[13]) remain in oversold territory on the weekly chart, while the psychological level[14] of $50,000 remains as resistance.
Bitcoin (BTC/USD) Weekly Chart
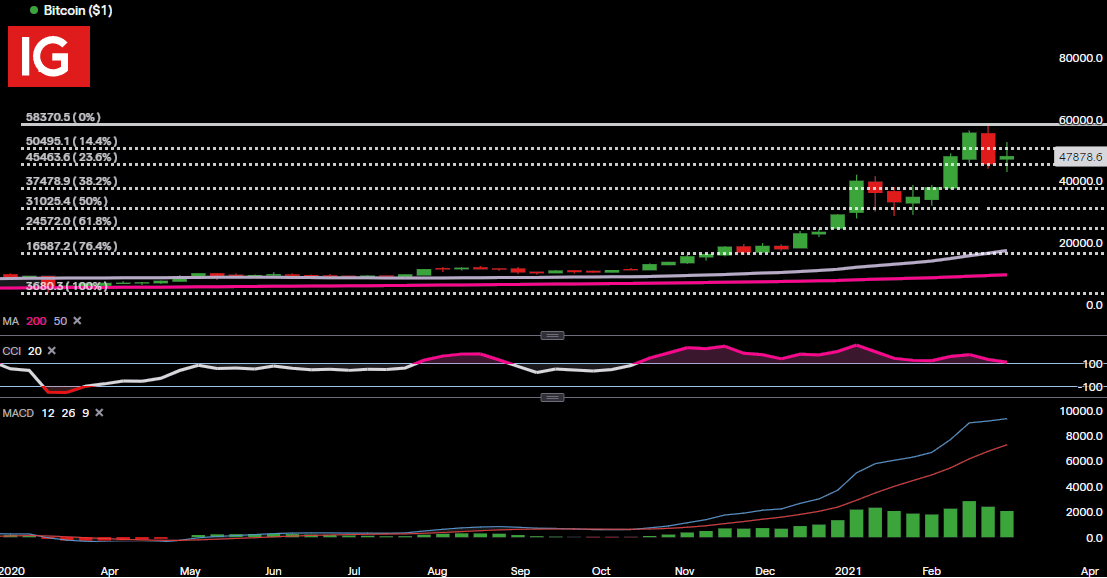
Chart prepared by Tammy Da Costa[15], IG
Meanwhile, on the daily chart, price action remains above both the
