
USD/ZAR ANALYSIS
RAND FUNDAMENTAL BACKDROP
Emerging Market (EM)[3] currencies have felt the pinch globally as the U.S. Dollar[4] reminded currency markets of its power as the worlds reserve currency. The Rand was one of the worst hit by an uptick in U.S. bond yields this past week as South African linked commodity[5] prices also took a tumble – iron ore, spot platinum and spot gold[6]. Yesterday’s speech by Fed Chair Powell failed to put concerns over rising yields at ease which could be to the detriment of the Rand in the short to medium-term.
The chart below outlines the positive correlation between the U.S. treasury yields (yellow) and the USD/ZAR[7] spot rate (blue), while the white line represents the MSCI Emerging Market Currency Index which highlights the recent EM decline.
USD/ZAR[8] VS U.S. 10Y T-NOTE YIELD VS MSCI EM CURRENCY INDEX

Chart prepared by Warren Venketas[9], Refinitiv
ECONOMIC ANNOUNCEMENTS
Monthly NFP data[10] is scheduled later today which will likely result in short-term volatility[11] around USD[12] crosses. Should actual data deviate significantly from estimates, USD/ZAR could see key breaks in price.
Source: DailyFX economic calendar[13]
TECHNICAL ANALYSIS
USD/ZAR WEEKLY CHART
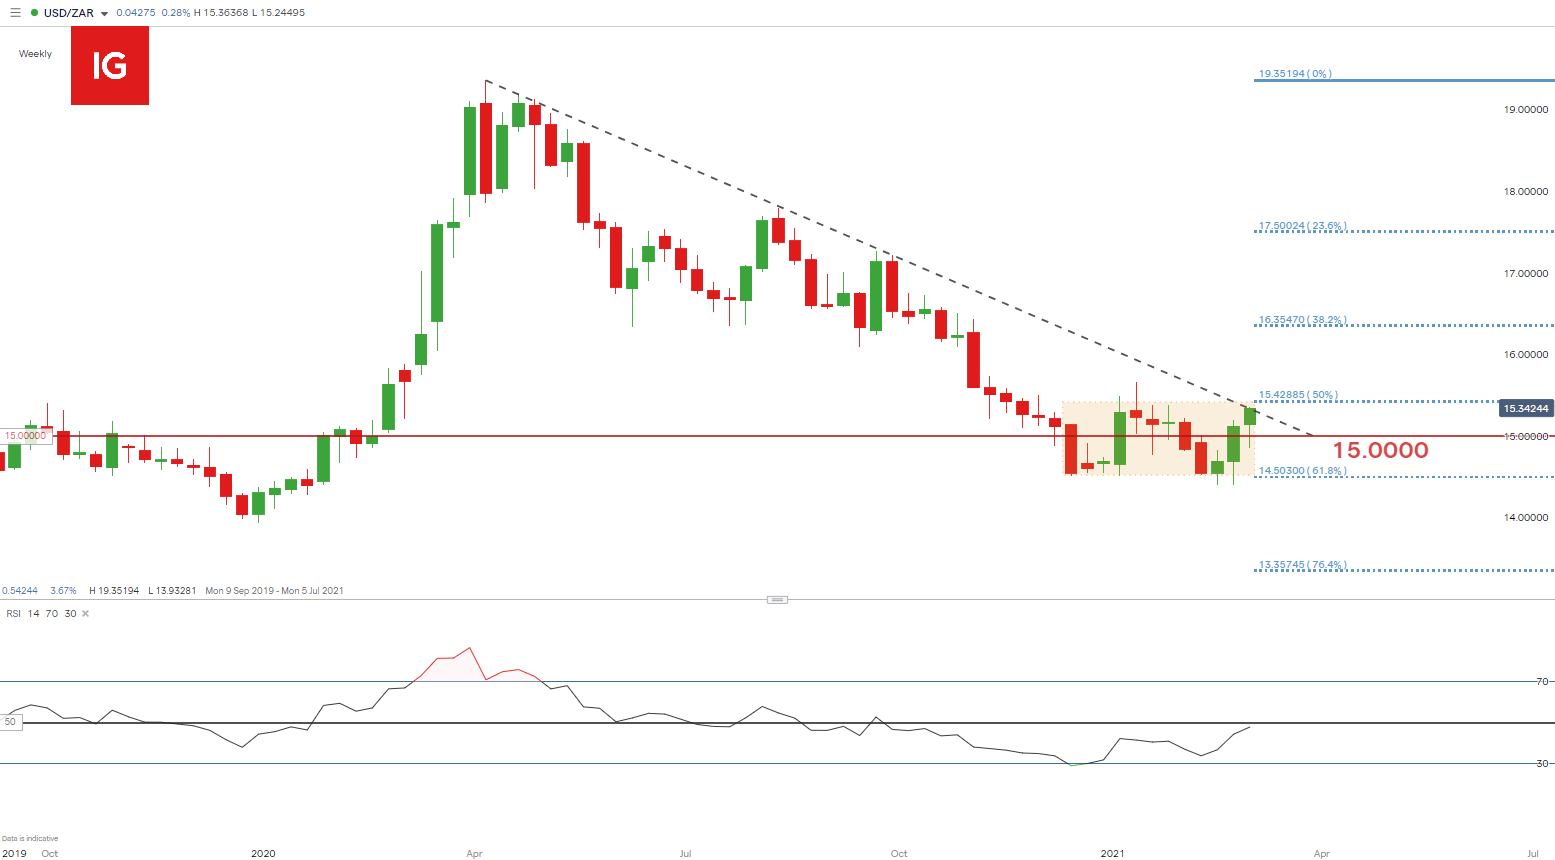
Chart prepared by Warren Venketas[14], IG
The existing rectangle consolidation pattern[15] (yellow) on the weekly USD/ZAR chart is approaching topside resistance as well as the coinciding trendline (dashed black line). Rectangle resistance falls in line with the 50% Fibonacci retracement level[16]
