
USD/JPY ANALYSIS
The Bank of Japan (BoJ)[1] yesterday announced that rates were to remain constant at -0.1%. This kept in line with the consensus view by economists and analysts alike. In addition, their stance remained extremely accommodative while persisting with its yield curve control program. With regard to imports and exports, there was a substantial trade surplus as imports declined significantly by 11.6%. These announcements had minimal overall effect on the Yen with only short-term price fluctuations apparent around the statements.
The last week has been relatively subdued in terms of price movement for the USD/JPY[2] pair. The Yen continues to follow the longer-term downward trajectory as global factors dictate sustained Dollar weakness.
JPY EBS flow data:
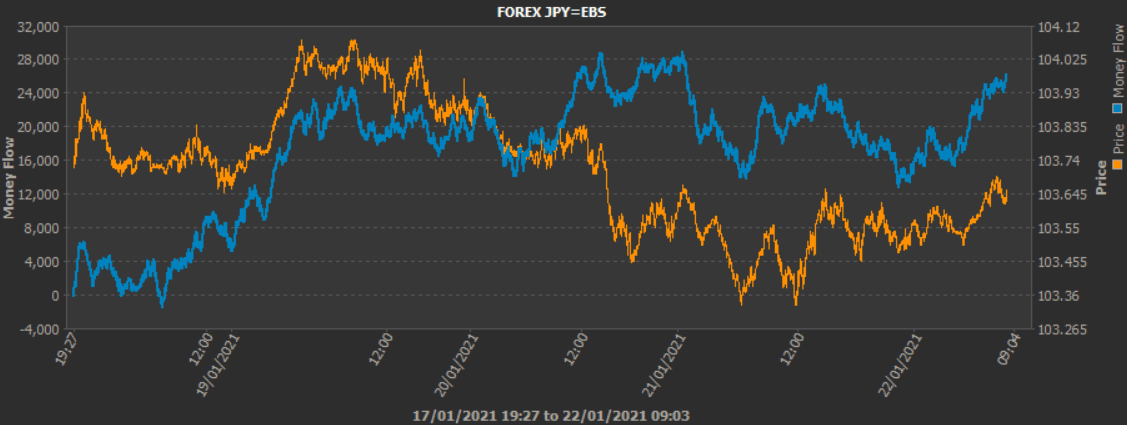
Source: Refinitiv
The EBS flow data for the Yen shows sustained buying of USD/JPY[3] throughout the week however, was temporarily interrupted by stimulus hopes after President Biden’s inauguration on Wednesday. The U.S. remains as the main driver for the current pessimistic outlook on USD/JPY[4].
USD/JPY TECHNICAL ANALYSIS
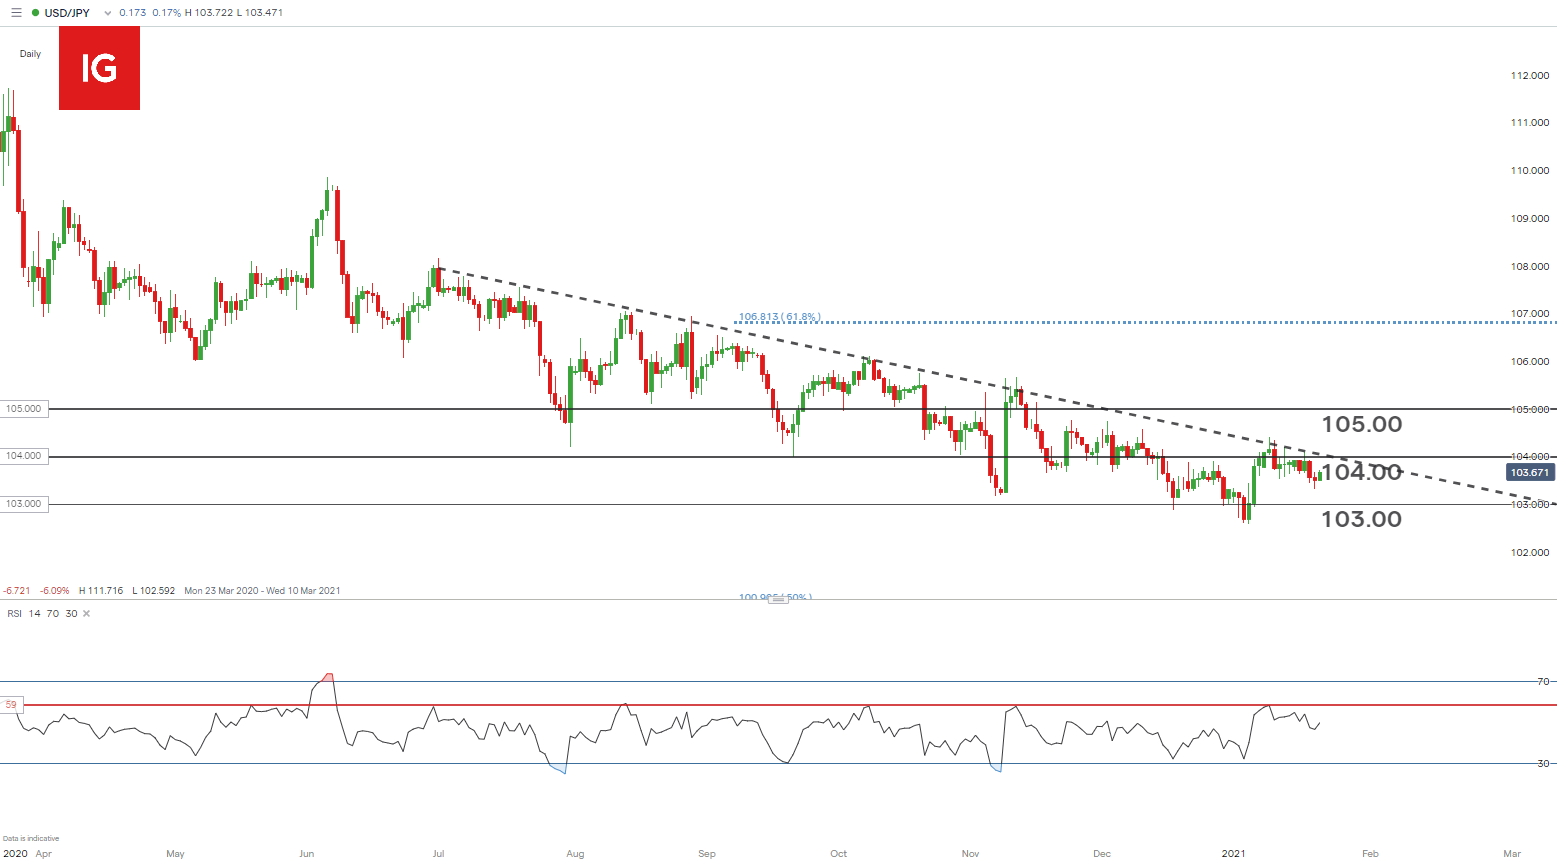
Chart prepared by Warren Venketas[6], IG
The long-term downward trend (dashed black line) continues to serve as a stubborn resistance level for the pair. Initial resistance still looms around the 104.00 psychological level[7].
The Relative Strength Index (RSI)[8] may approach the 59 level which has provided a good indicator for maximum upside since July 2020. Although the index currently sits at 50 which is neither bullish nor bearish, the long-term bias remains heavily skewed to the downside.
Yen bulls will look for 103.00 in the medium-term while short-term bearish setups may be best served by waiting for further upside toward resistance before any execution takes
