
USD/ZAR ANALYSIS
VACCINE ARRIVALS VS RISING CASES
Last week brought about a shift from US Dollar[2] and global risk stimuli to a more locally focused impact on the USD/ZAR[3] currency pair. With rising deaths and infection rates in South Africa, the announcement of vaccines from India have only provided temporary respite. There is extensive debate on rollout procedures and logistics which are yet to be endorsed by many major stakeholders including much of the South African public.
TECHNICAL ANALYSIS
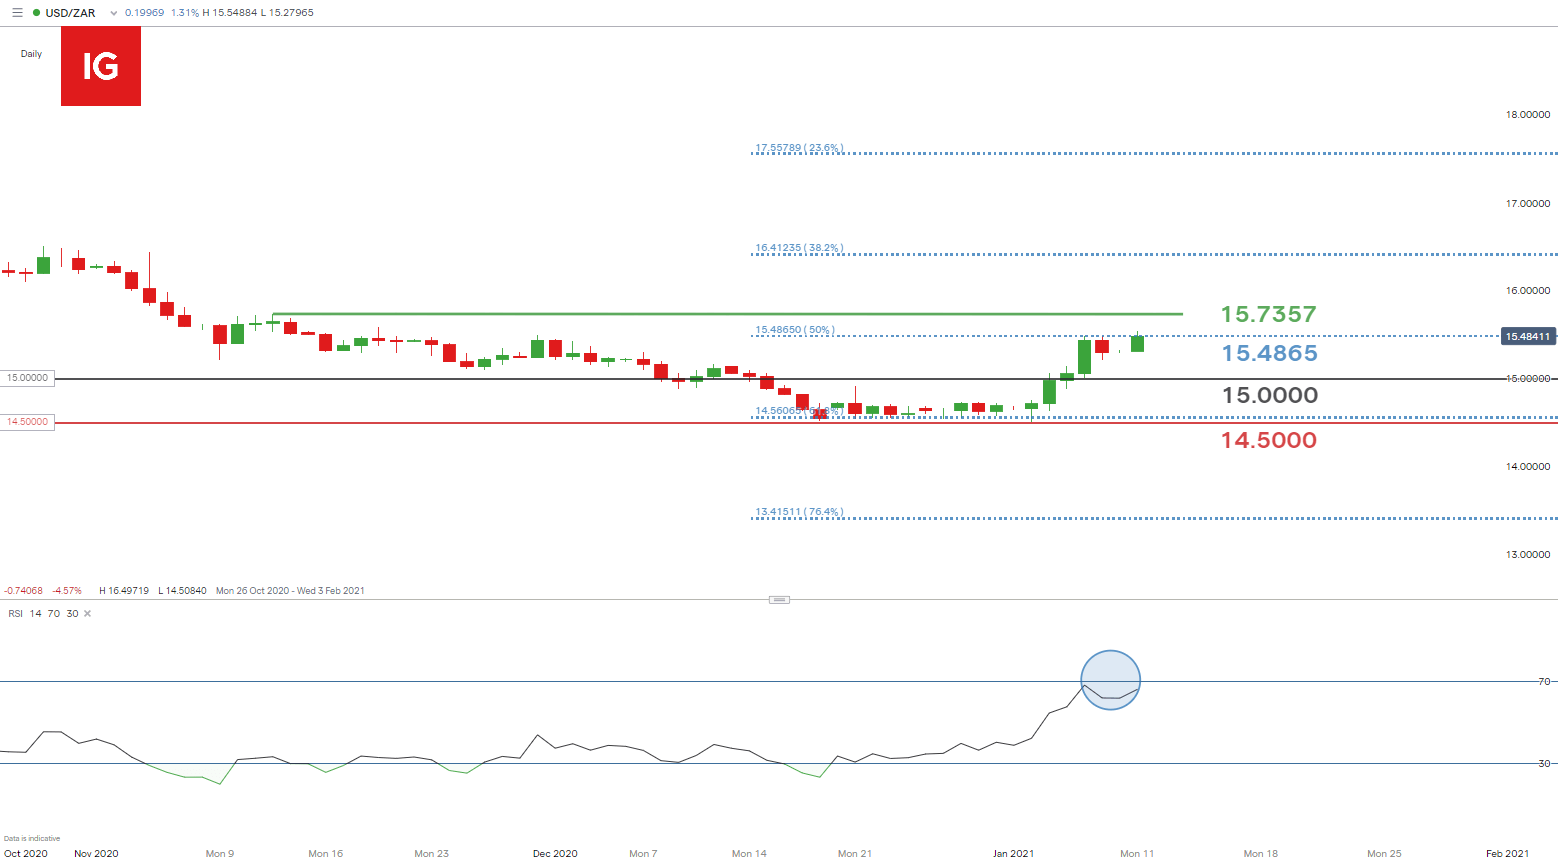
Chart prepared by Warren Venketas[5], IG
The end of November was the last time prices touched the 15.4865 level. This level is key as it marks the 50% Fibonacci level which was taken from February 2018 lows to April 2020 highs. This is a major area of confluence which has served as both support and resistance multiple times dating back to 2016. A confirmed break above or below could serve as a short-medium term indication of the Rand going forward.
Currently the Relative Strength Index (RSI)[6] is approaching overbought levels which may suggest this short-term rally has run its course. The fact that price has respected the 15.4865 level represented by 4 consecutive daily candles, illustrates the importance of this horizontal resistance zone.
The persisting longer-term downtrend, overbought RSI and resistance at the 50% Fibonacci level could point towards a possible continuation of the downtrend and a push lower toward the 15.0000 psychological level. Alternatively, a stronger US Dollar[7] and a worsening COVID-19 situation in
