
Mexican Peso Technical Price Outlook: USD/MXN Near-term Trade Levels
- Mexican Peso updated technical trade levels – Daily & Intraday Charts
- USD/MXN[1] decline fails to hold below support – risk for bear market recovery
- Key near-term resistance 20.6301 – decline vulnerable into 19.8794
The US Dollar[2] plummeted more than 9.2% off the monthly highs against the Mexican Peso with USD/MXN[3] now probing longer-term technical support. While the broader outlook remains weighted to the downside, the bears may be vulnerable near-term just above downtrend support. These are the updated targets and invalidation levels that matter on the USD[4]/MXN technical price charts. Review my latest Strategy Webinar[5] for an in-depth breakdown of this Peso setup and more.
Mexican Peso Price Chart – USD/MXN Daily
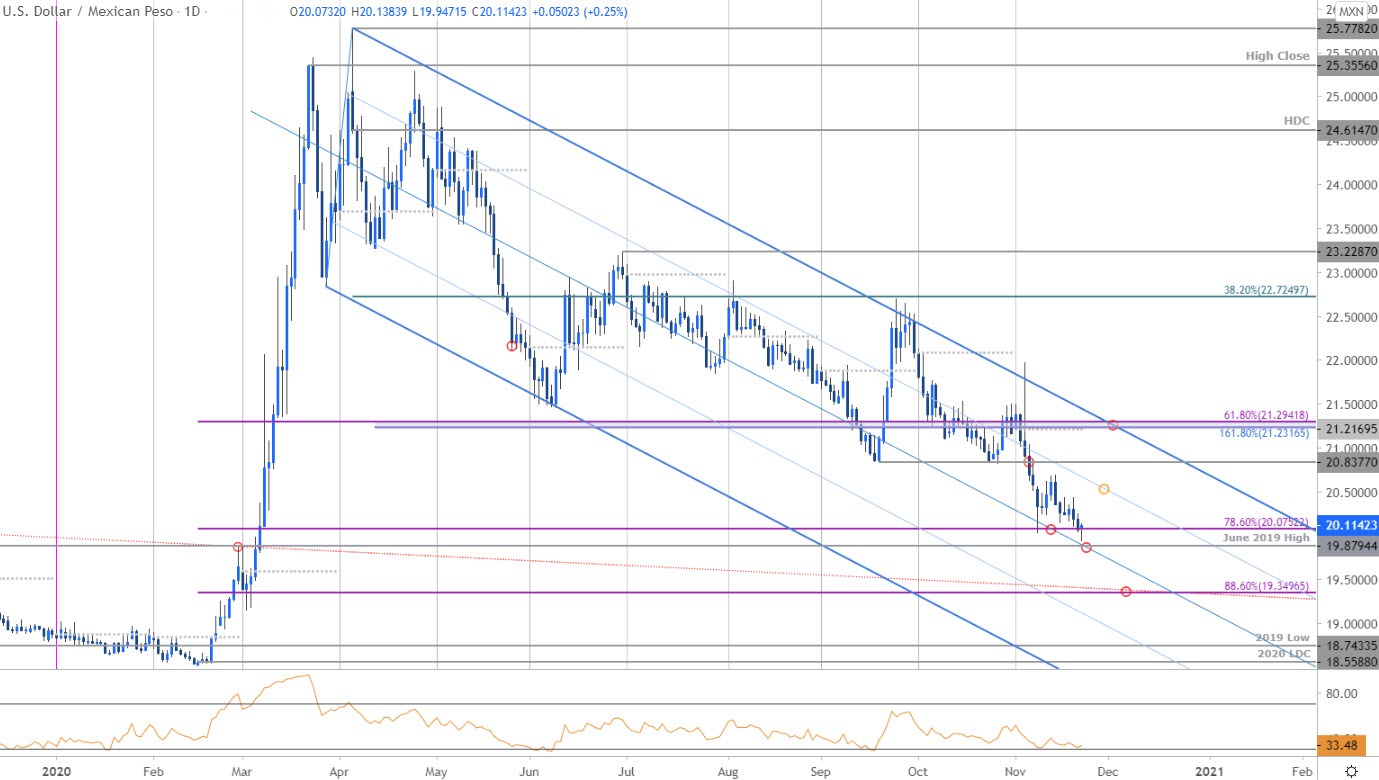
Chart Prepared by Michael Boutros[6], Technical Strategist; USD/MXN on Tradingview[7]
Technical Outlook: In my last Mexican Peso Price Outlook[8] we noted that USD[9]/MXN was probing a key support zone at the, “2019 high-day close / Fibonacci support at 20.0752/1360 – looking for inflection off this threshold.” Price closed last week just below this threshold with reversal candle today threatening a recovery within the broader downtrend.
Initial daily resistance[10] eyed at the 75% parallel (currently ~20.6500) backed by the September low at 20.8377- broader bearish invalidation steady at 21.2317/2942. Look for a close below the June 2019 highs at 19.8794 to mark resumption with such a scenario exposing the 88.6% Fibonacci[11] retracement at 19.3497.
Mexican Peso Price Chart – USD/MXN 120min

Notes: A closer look at Peso price action shows USD/MXN continuing to trade within the confines of a near-term descending pitchfork formation[12] extending off
