

Chart created with TradingView[1]
Nasdaq 100, DAX 30, CAC 40, Nikkei 225 Price Outlooks:
Nasdaq 100 Forecast
Outlook: Neutral
The Nasdaq 100 suffered a substantial pullback last week after leading technology stocks like Apple, Tesla, Nvidia and Salesforce broke down.[2] After months of remarkable gains, many analysts had voiced concerns over the current valuations of some tech companies and last week saw the Nasdaq feel the effects of such apprehension. That said, little has changed from a fundamental standpoint since early last week and economic data actually came in above expectations.
Nasdaq 100 Price Chart: 1 – Hour Time Frame (July 2020 – September 2020)
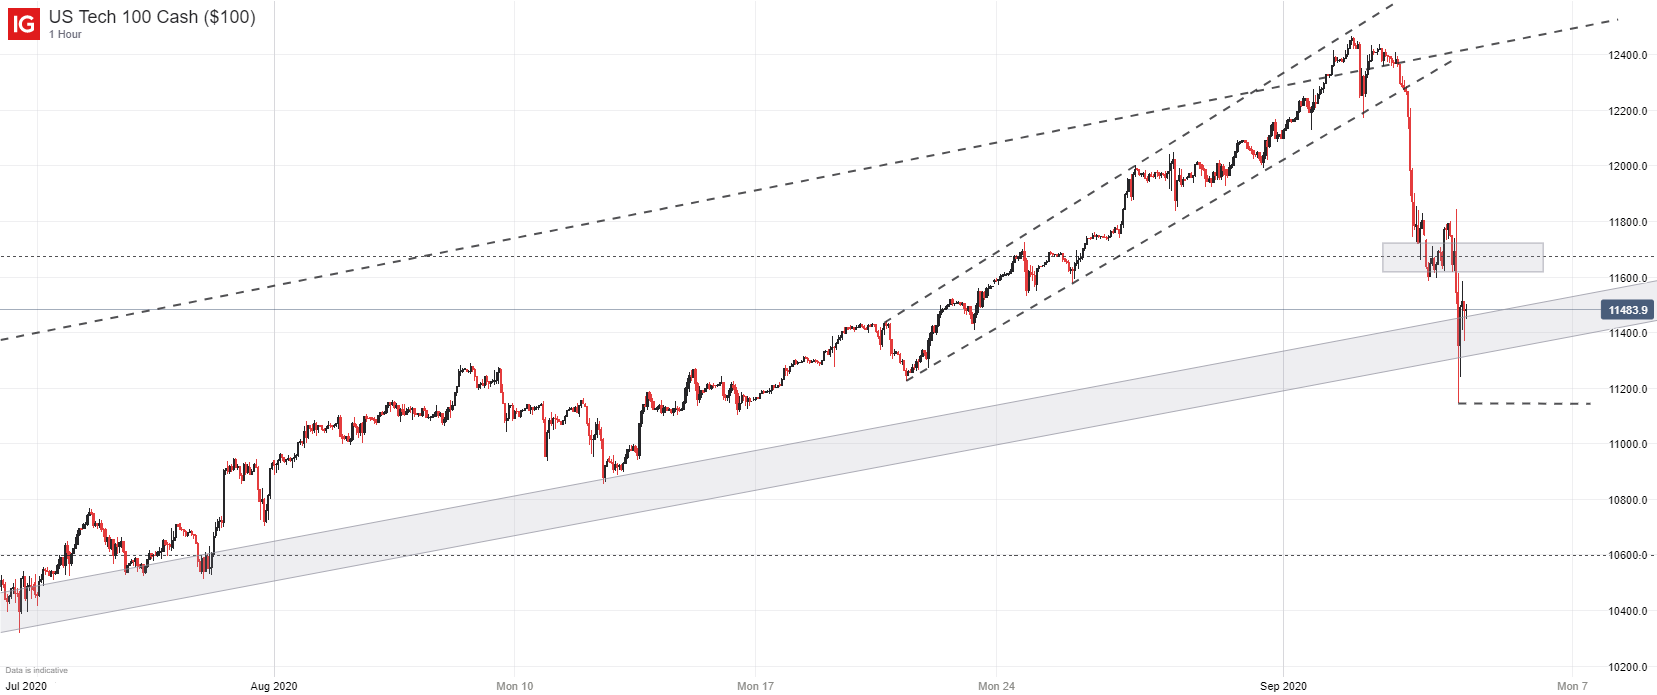
With that in mind, many traders have blamed profit-taking for the losses experienced on Thursday and Friday while others applauded the imminent demise of overvalued tech stocks. Either way, non-farm payrolls impressed[3] alongside services PMI,[4] both of which are hard data figures that can feed into the fundamental conversation. In terms of concrete changes to the technology space, few have occurred other than negative price moves. Thus, bears might have to display further conviction before the entire market is convinced.
Stock Market Basics: A Beginner’s Guide to Trading Stocks[5]
Consequently, it may be too soon to suggest a steep stock market crash, particularly when taking seasonality into consideration. As August concluded, we covered the seasonal trends typically experienced in September,[6]highlighting a general rise in volatility and a modest decline in equity markets in past years. Thus, recent price action is somewhat unsurprising – although the pace and abruptness with which it occurred may be more concerning.
Suffice it to say, US equity markets will continue to take their cues from the Nasdaq 100 in the week ahead.
