
Mexican Peso Technical Price Outlook: USD/MXN Near-term Trade Levels
- Mexican Peso updated technical trade levels – Daily & Intraday Charts
- USD/MXN[1] trading at near-term support into the start of the week
- Risk for topside exhaustion ahead of 22.8178– critical support 22.1495
The US Dollar[2] is unchanged against the Mexican Peso early in the week with USD/MXN[3] trading just above near-term technical support. Price has continued to trade within the confines of a multi-week descending pattern and rebounds may be limited while within this formation. These are the updated targets and invalidation levels that matter on the USD[4]/MXN technical price charts. Review my latest Weekly Strategy Webinar[5] for an in-depth breakdown of this Peso trade setup and more.
Mexican Peso Price Chart – USD/MXN Daily
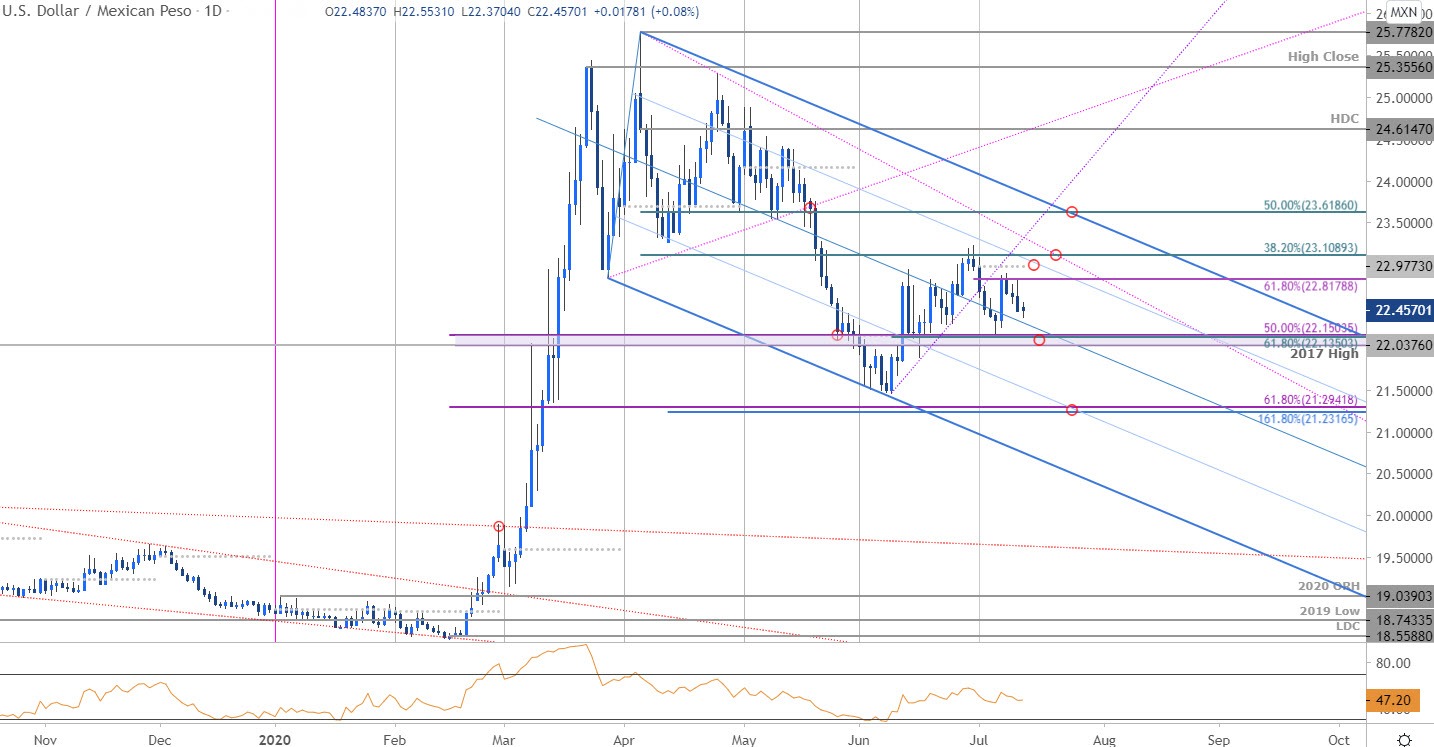
Chart Prepared by Michael Boutros[6], Technical Strategist; USD/MXN on Tradingview[7]
Technical Outlook: In my last Mexican Peso Price Outlook[8] we noted that USD[9]/MXN had rebounded off key near-term support and to, “be on the lookout for possible topside exhaustion near downtrend resistance IF price is indeed heading lower,” with, “22.8176 & 22.9425 – both levels of interest.” The recovery registered a high at 22.8983 last week before faltering with the subsequent pullback trading just above median-line[10] support early in the week.
Critical support remains at the 2017 swing high / 61.8% retracement at 22.0376/1350 – note that this threshold also defines the July opening-range[11] lows and a break / close below is needed to mark resumption of the broader downtrend. Daily resistance stands at 22.8178 backed by the monthly open at 22.9773- broader bearish invalidation steady at 23.1089.
