
Gold Price Analysis:
- Gold[1] has had a brisk start to Q3 as Gold prices have set a fresh eight-year-high.
- Today’s breakout has Gold flying past a couple of previously key resistance levels.
- Can Gold bulls muster even more strength? The answer to that is likely based around FOMC[2] expectations and hints as to what might be around-the-next-corner.
Gold Breakout Takes Out 1800
It’s been a strong start to Q3 and H2 for Gold prices. After spending about two months in a rather consistent range during the second quarter[3], buyers began to push in late-June and as the page has turned into July, that strength has continued to show. This has allowed for Gold prices to set yet another fresh high, this time an eight-year-high as the 2012 swing at 1796 has now been traded through.
As looked at last week, July trade started off hot in Gold as bulls pushed up to a fresh high[4] shortly after midnight eastern time; and this was followed by a quick pullback, with a show of support around prior resistance, taken from the swing high sitting at the approximate 1765 level. Since then, buyers have remained large and in-charge, helping to break the 1800 level on the way to those fresh eight-year-highs.
Gold Price Eight-Hour Chart
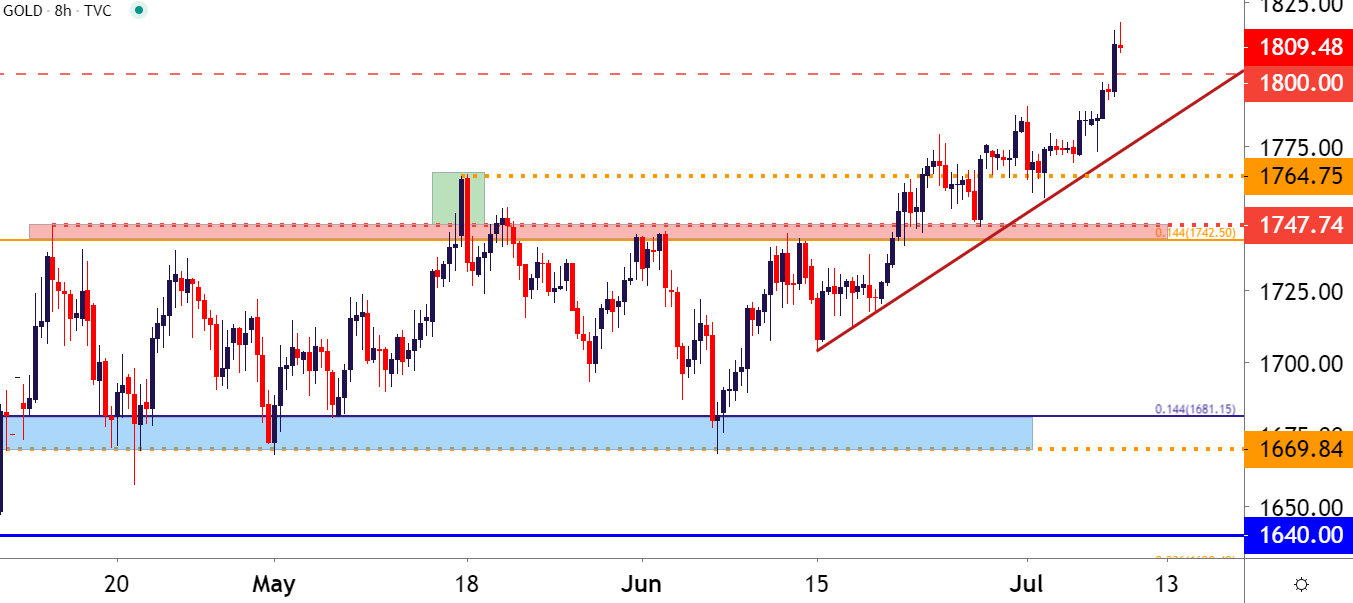
Chart prepared by James Stanley[5]; Gold on Tradingview[6]
Gold Prices Testing Key Area on Long-Term Charts
This recent bullish breakout has propelled Gold prices into some rarified air. It’s been quite a while since Gold has traded above 1800, and the last time this had happened, hopes remained that Gold prices would continue to gain similar to what had happened in the 2008-2011 backdrop. But, as the
