
Technical Outlook:
GBP[3]/USD[4] broke the sturdy March trend-line last week, and then retested the broken threshold. The sequence has price heading lower within the confines of a channel off the recent high. Looking lower, a break below 12335 will put Cable at risk of sinking towards the next area of support under 12200. It will take a powerful push back above 12542 and the recapturing of the broken trend-line to turn the picture positive.
GBP/USD 4-hr Chart (looks headed lower)
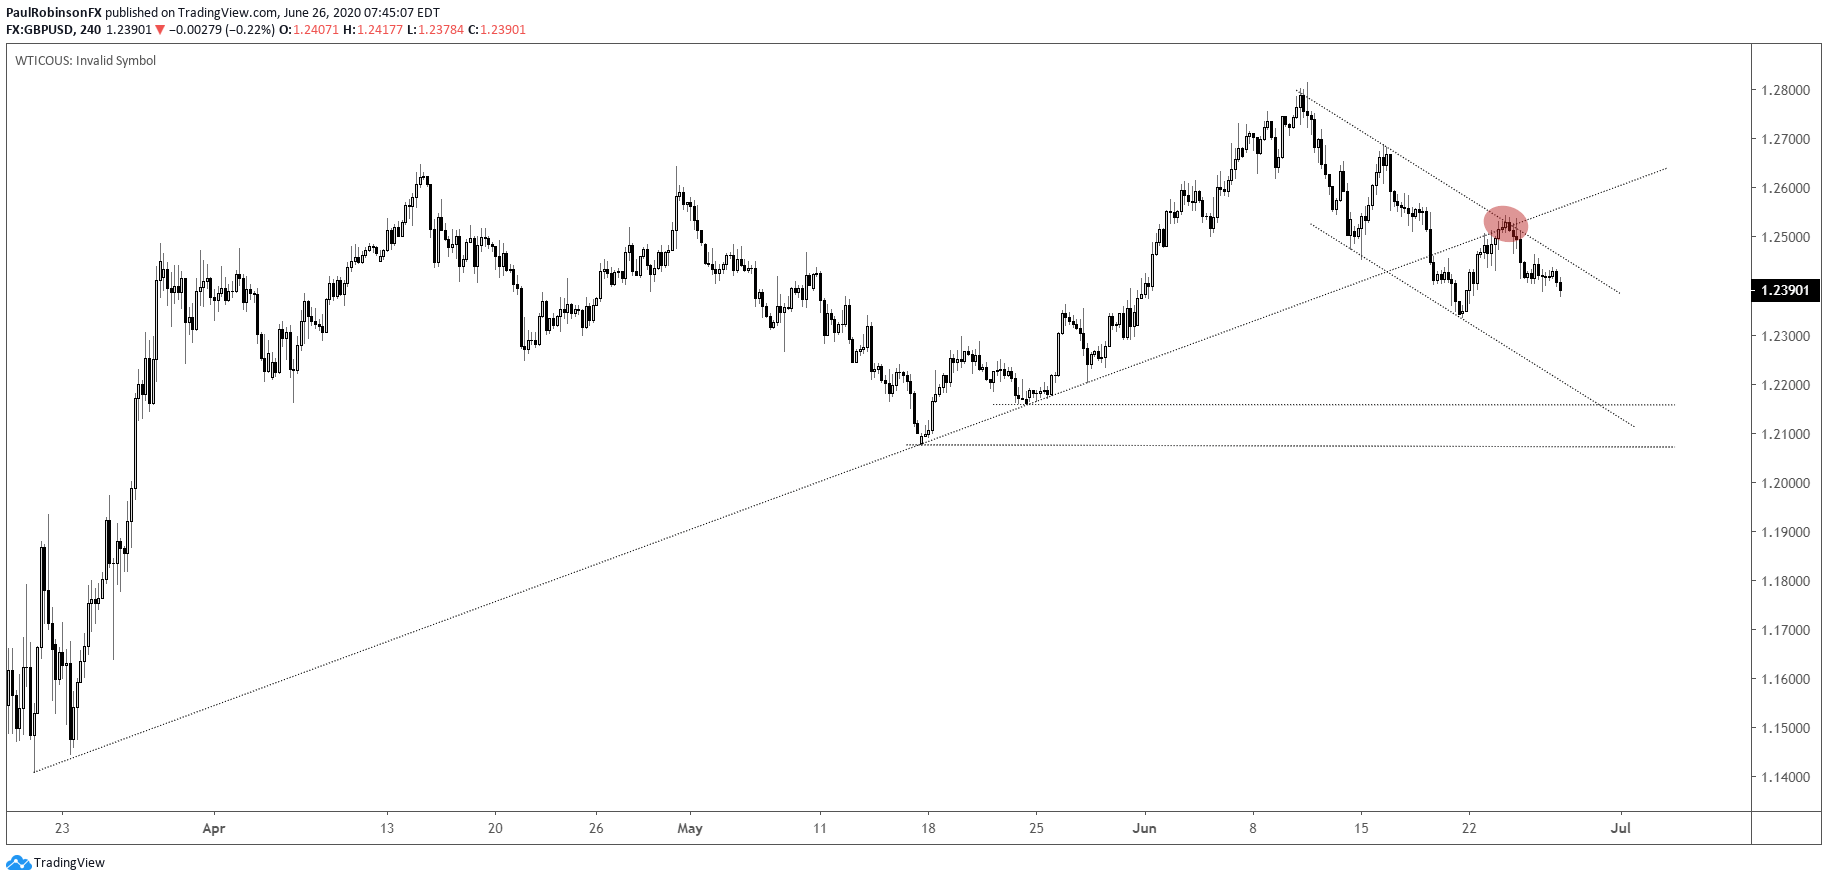
GBP/USD Chart by TradingView[5]
AUD[6]/JPY[7] is sitting on a couple of lines of support following a rejection from over 7600. The lack of upside response is in-line with general risk trends. This may change though and so support needs to be respected until broken. There is a wedge pattern developing that could add some punch to an eventual break. A break higher will have 7508 then the high at 76.74 in focus, while a breakdown could have strong support at 7000 in play.
AUD/JPY 4-hr Chart (broke support)

AUD/JPY Chart by TradingView[8]
For all the charts we looked at, check out the video above…
Resources for Forex Traders
Whether you are a new or an experienced trader, DailyFX has several resources available to help you; indicator for tracking trader sentiment[9], quarterly trading forecasts[10], analytical and educational webinars[11] held daily, and trading guides[12] to help you improve trading performance.
---Written by Paul Robinson, Market Analyst
You can follow Paul on Twitter at @PaulRobinsonFX[13]
