
Mexican Peso Highlights:
Peso poised to continue sell-off
USD[3]/MXN started circling back higher earlier this week and gained momentum yesterday, putting it in position to take on and potentially take out resistance. A close above 23 is seen as putting the Dollar in charge vs the Peso as it rounds its way toward turning a bounce into a rally.
A breakout above the 23 level could quickly have the area near 25 in focus, especially if stocks begin to weaken again. For now, getting above resistance is first up. Failing below 21.88 would be the first warning sign that resistance is not only holding, but that selling wants to reassert itself.
USD/MXN Daily Chart (resistance to overcome)

USD/MXN Chart by TradingView[4]
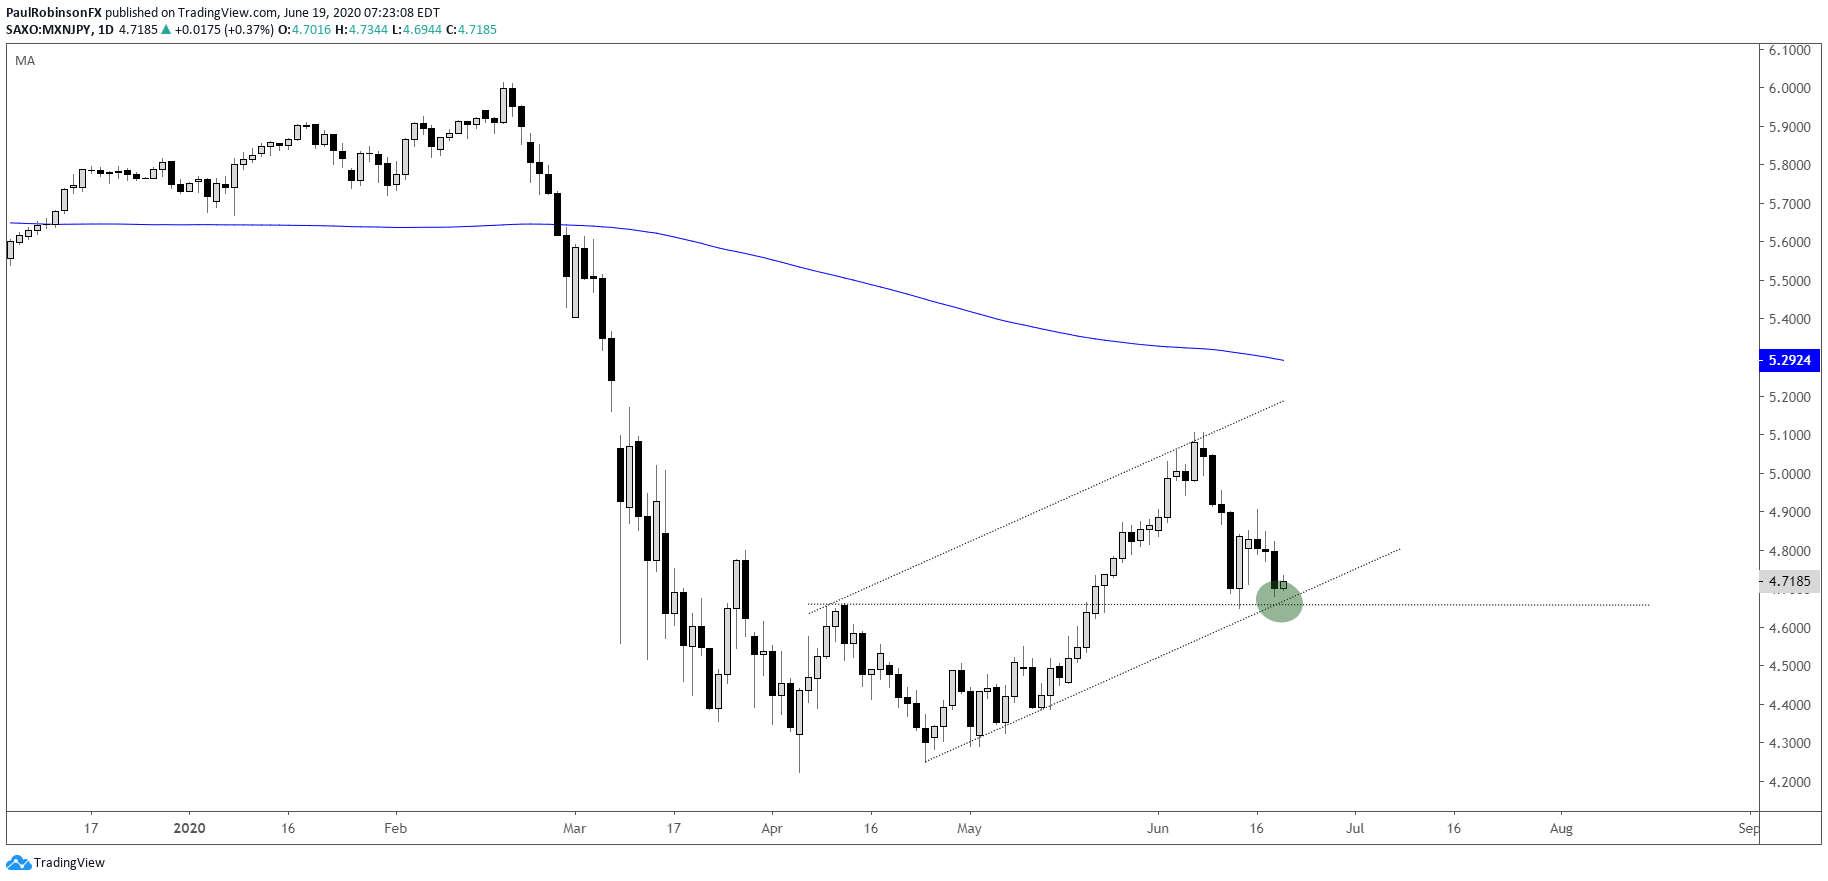
Turning to MXN/JPY, this one really follows along with the behavior of the stock market on a correlation-basis (due to its massive carry), but in terms of magnitude it goes down harder than it goes up with the stock market.
Highlighting the sensitivity to the stock market is a 3-mo correlation of 0.79, but often trading close to 0.90 and higher. If stocks rally hard it may firm up, but if they roll over then look for those spring time lows to come into play.
This makes MXN/JPY a potentially easier short candidate as a stock market proxy than it does an option for being long stocks through FX. Trade below 4.64 and a retest of the low from April could be in the works down in the 4.22-area.
MXN/JPY Daily Chart (watch support, then lows)
Resources for Forex Traders
Whether you are a new or experienced trader, we have several resources available to help
