

The Dow Jones[1] is rising within a channel as is the S&P 500[2], which keeps the near-term picture pointed higher even if the rally looks like it could get tested soon. For the Dow there is a gap-fill along with the 2016 trend-line to watch around 24700/25000. For the S&P 500 the equivalent area is around the 2900 level. We discussed the S&P 500 hourly chart and using the parallels that create the channel as guides. Stay within and the trading bias remains up, fall below the lower parallel and the bias shifts neutral to negative.
Dow Jones Daily Chart (channel)
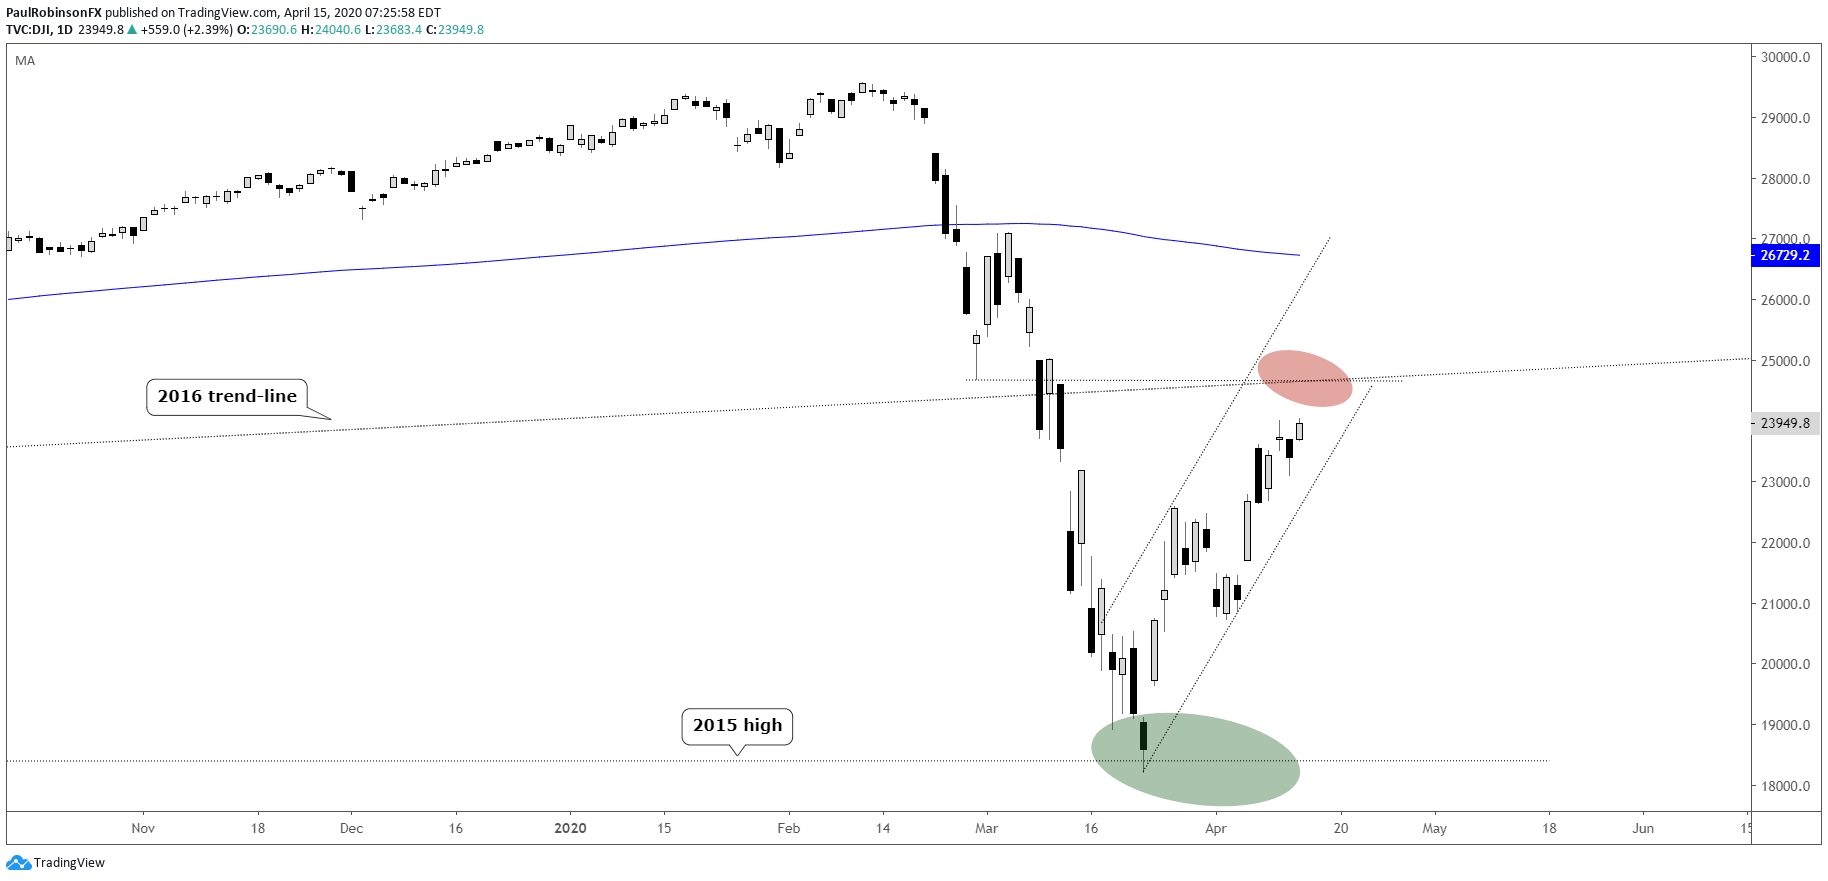
Dow Jones Chart by TradingView[3]
S&P 500 Hourly Chart (using channel as guide)

S&P 500 Chart by TradingView[4]
The DAX[5] is creating a rising wedge formation that could end up leading the index lower, but as is the case with the U.S. indices and their respective channels, the underside line of the pattern must first be broken. There are plenty of levels to watch ahead, with the biggest being a gap from the early-part of March to the underside of a trend-line from 2011. On the chart below, the wedge is noted along with several price levels to watch in the event the wedge forms and is triggered.
DAX Hourly Chart (ascending wedge formation)

Crude oil[7] can seemingly find no reason to rally, and this has it set up to remain weak for a while. But with it trading around the prior low and still generally oversold, a digestion period may be what comes next. It could very well lead to oil becoming a teenager if this is the case. For now, risk/reward doesn’t appear favorable for
