

Mexican Peso Technical Price Outlook: USD/MXN Trade Levels
- Mexican Peso updated technical trade levels – Weekly Chart
- USD/MXN[1] posts weekly reversal off long-term uptrend resistance
- Risk for a deeper correction while below 24.8205.
The Mexican Peso surged more than 6.5% vs the US Dollar[2] last week with USD/MXN[3] posting a massive outside weekly-reversal off multi-year uptrend resistance. The Dollar is paring a portion of the decline early in the week but the threat of a larger correction in the days ahead remains. These are the updated targets and invalidation levels that matter on the USD[4]/MXN weekly price chart. Review my latest Strategy Webinar[5] for an in-depth breakdown of the setupswe’re tracking this week.
Mexican Peso Price Chart – USD/MXN Weekly
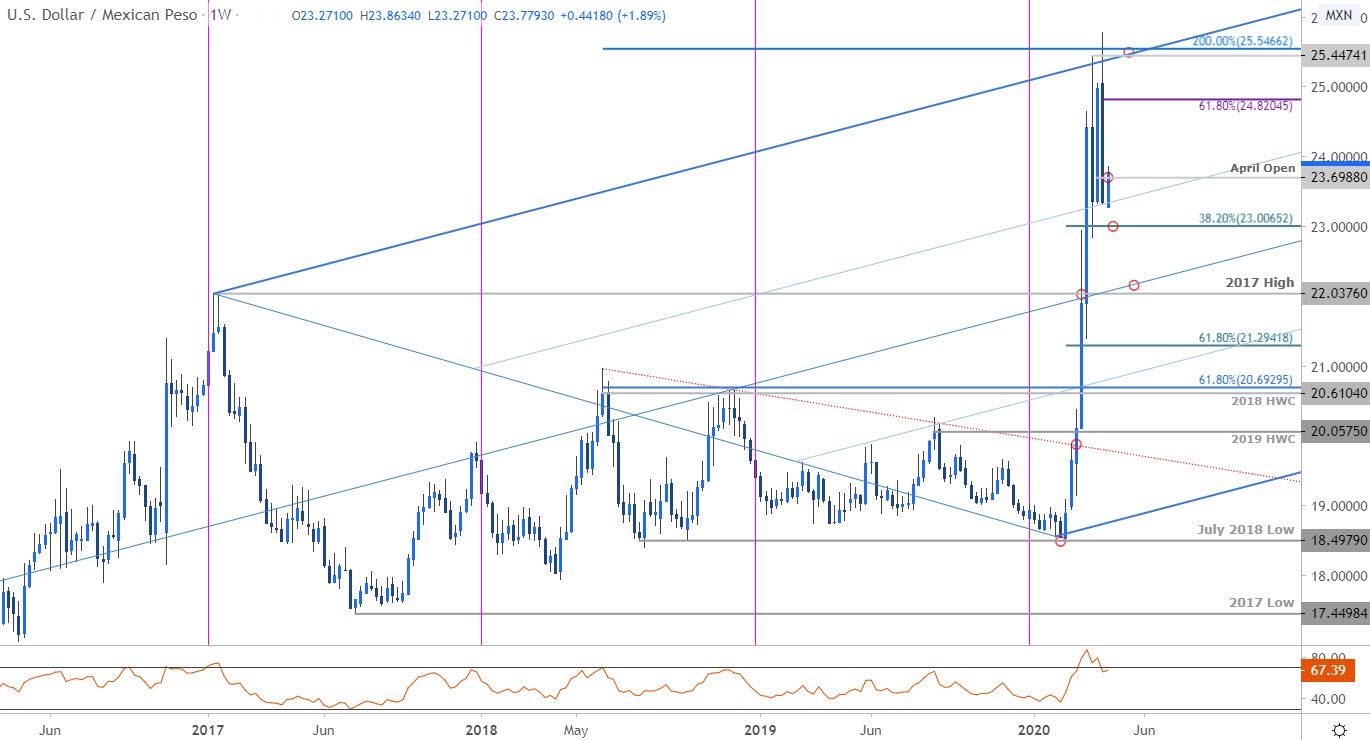
Chart Prepared by Michael Boutros[6], Technical Strategist; USD/MXN on Tradingview[7]
Notes: In my last Mexican Peso Price Outlook[8] we noted that USD[9]/MXN had, “responded to a key technical confluence and the immediate USD/MXN rally may be vulnerable while below up-slope resistance.” The level in focus was 25.4474/5466 – a region defined by pitchfork[10] resistance, the March high and the 200% extension of the 2017 advance. The rally registered a high at 25.7782 before marking an outside-day reversal with price posting an outside weekly reversal off confluence resistance last week.
USD/MXN opened the week just above slope support at the 38.2% parallel with price poised to mark yet another outside day reversal today- this time, to the topside. While we may see more upside on this relief rally, the broader risk remains for a deeper setback while below the 61.8% retracement[11] of monthly range at 24.8205. Weekly open
