

The Dow Jones[1] opened yesterday right at the gap-fill we have been discussing as an initial target off the lows. It is inside a channel at the moment, and for now will use that as a guide. The market is heading higher as long as the underside trend-line is maintained, but if it breaks we may see another swoon back towards the low that developed around the 2015 peak, or worse. If the channel stays intact then the underside of the 2016 trend-line will be the next spot to look for the market to potentially weaken from.
Dow Jones Daily Chart (gap-filled, channel forming)

Dow Jones Chart by TradingView[2]
Oil[3] tried to get up off the lows, with the help of some headlines recently, but it is fading back lower again. It is in a tough spot at the moment, with the spike off the lows having been half-way retraced. Will a higher low develop or are we about to see a new leg lower? Ideally, if we are to see more weakness then a consolidation phase develops first, then a breakdown. If oil is to bottom a higher low soon is needed before trying to breakout above 28.93.
Crude Oil Daily Chart (higher low or congestion pattern)
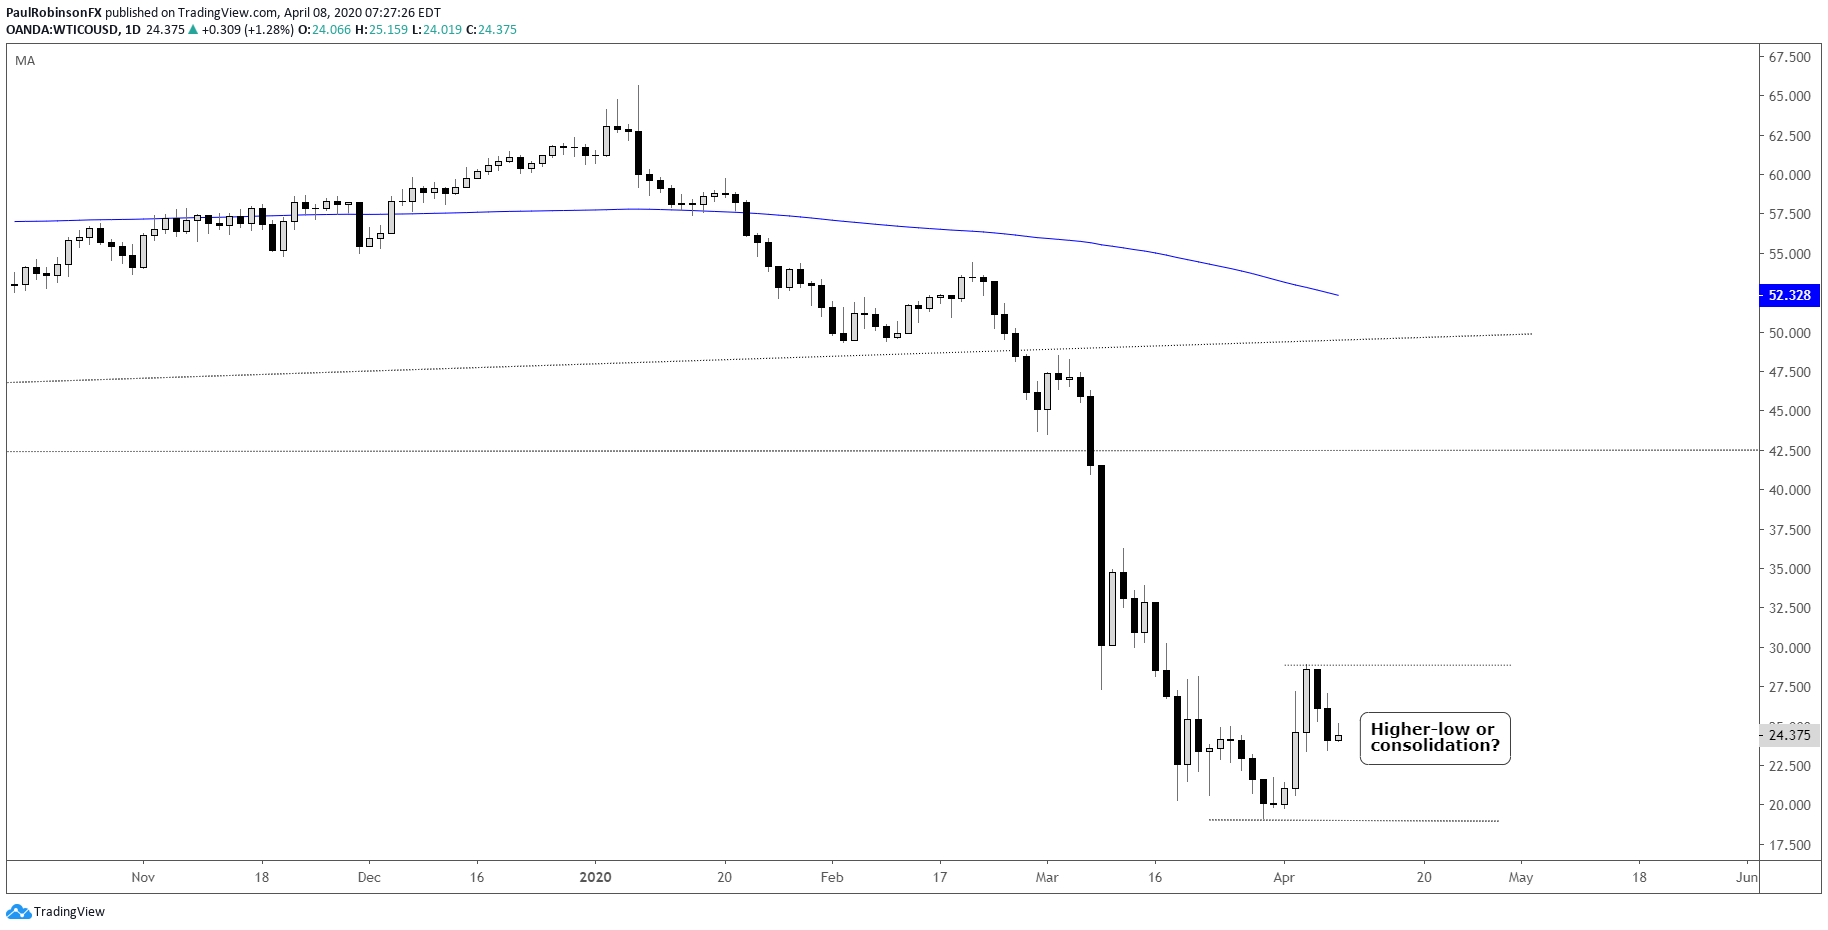
Crude Oil Chart by TradingView[4]
To see all the charts we looked at, check out the video above…
Resources for Index & Commodity Traders
Whether you are a new or an experienced trader, DailyFX has several resources available to help you; indicator for tracking trader sentiment[5], quarterly trading forecasts[6], analytical and educational webinars[7] held daily, and trading guides[8] to help you improve trading performance.
We also have a
