

Mexican Peso Technical Price Outlook: USD/MXN Trade Levels
- Mexican Peso updated technical trade levels – Weekly & Daily Charts
- USD/MXN[1] breakout fails at record highs / key confluence resistance
- Immediate long-bias at risk below uptrend resistance / 25.5466
The Mexican Peso has plummeted a staggering 39% vs the US Dollar[2] with a multi-month breakout in USD/MXN[3] taking price to fresh record highs. The rally faltered today on a brief test above a critical multi-year resistance threshold and leaves the immediate long-bias vulnerable while below today’s highs. These are the updated targets and invalidation levels that matter on the USD[4]/MXN weekly price chart. Review my latest Strategy Webinar[5] for an in-depth breakdown of the setupswe’re tracking this week.
Mexican Peso Price Chart – USD/MXN Weekly
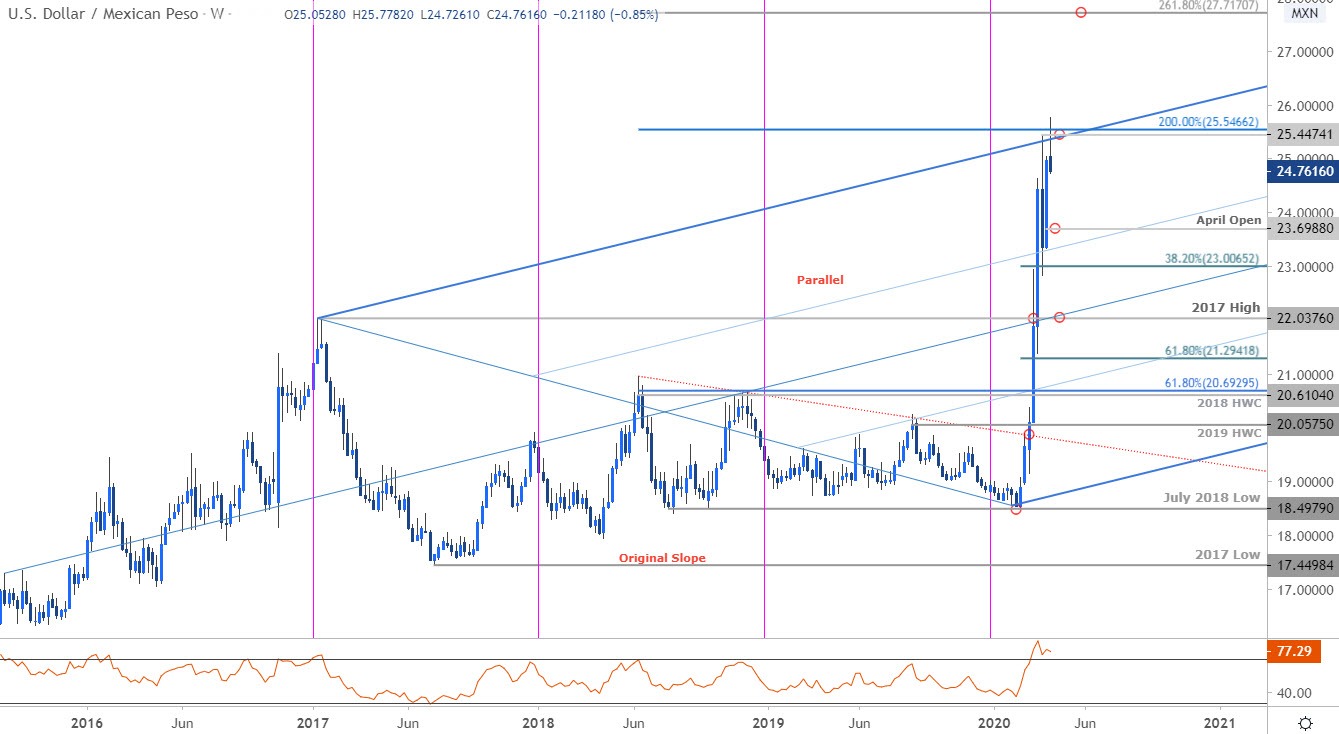
Chart Prepared by Michael Boutros[6], Technical Strategist; USD/MXN on Tradingview[7]
Notes: In my last Mexican Peso Price Outlook[8] we noted that USD[9]/MXN was approaching uptrend resistance of multi-year ascending pitchfork[10] formation with a topside breach exposing , “23.3500 backed by the 1.618% extension at 24.2050.” Price registered a high just above confluence resistance at the upper parallel / March high / 200% ext at 25.4474/5466 into the open of the week before reversing with weekly RSI marking bearish divergence into these highs (albeit week signal in overbought territory). The reversal leaves the broader long-bias risk near-term while below this critical threshold.
Monthly open support rests at 23.6988 backed by the 38.2% retracement[11] of the yearly range at 23.0065- a level of interest for possible downside exhaustion IF reached. Broader bullish invalidation now raised to the median-line / 2018 high at 22.0376. A topside breach
