

Nasdaq 100 Price Outlook:
- The Nasdaq[1] 100 possesses an encouraging technical picture compared to the Dow Jones[2]
- Yet volatility remains widespread and stocks pressured as the S&P 500 triggered another circuit breaker
- Should support fail, the Nasdaq may look for secondary assistance around the 2018 lows
Nasdaq 100 Forecast: Bulls Look to Hold Support as Index Turns Lower
Stocks resumed their decline in the second half of Wednesday trading as the S&P 500 fell 7% to trigger the first level circuit breaker. Should further losses occur, subsequent triggers reside at the -13% and -20% marks – the latter of which would halt trading for the remainder of the session.
At present, a direct catalyst behind the most recent leg lower is not readily apparent, but significant volatility in the foreign exchange market[3] could suggest liquidity concerns. Either way, a single catalyst isn’t necessarily required with the VIX continually trading at extremes[4], a sign investors remain uncertain about the future.
Nasdaq 100 Price Chart: Daily Time Frame (August 2018 – March 2020)
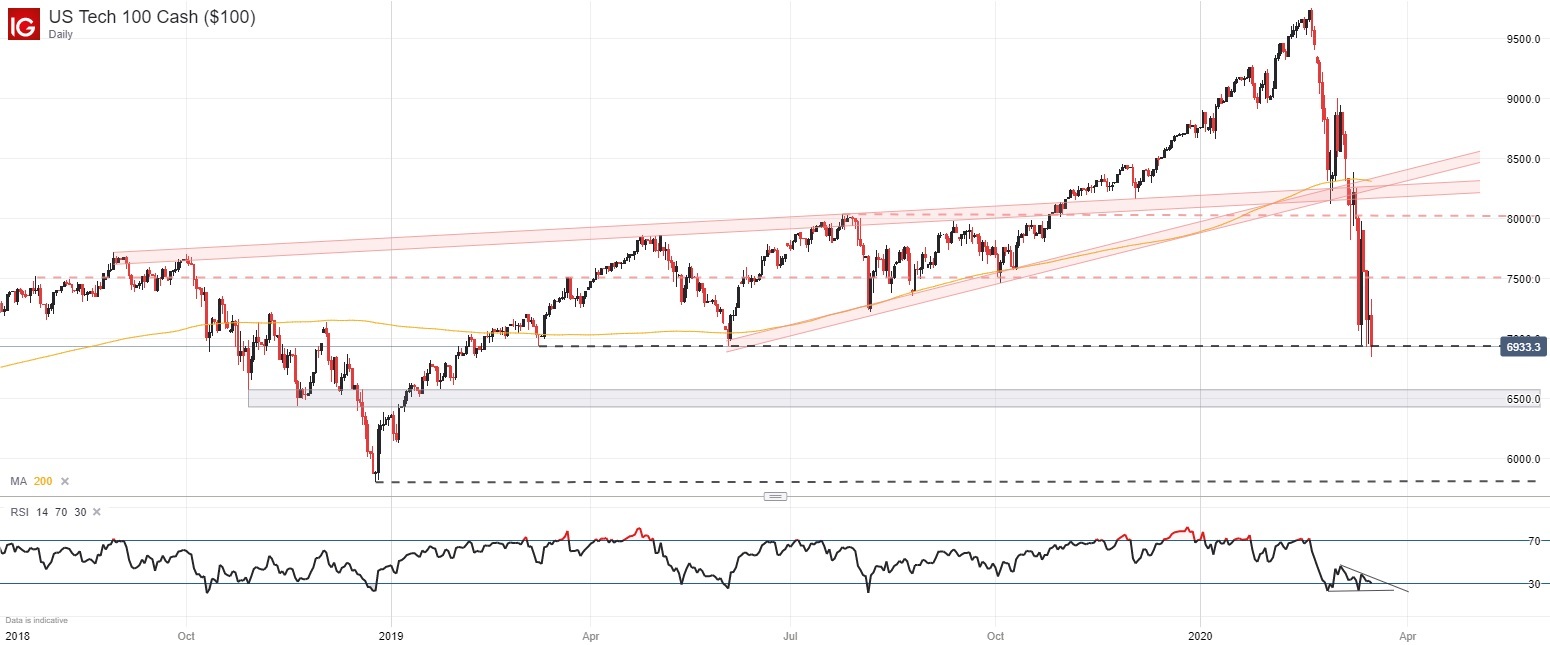
Nevertheless, the Nasdaq 100 will look to employ technical support around 6,940 which has recently suffered a modest break beneath. However, if bulls can post a daily close above the level on Wednesday, it should provide a modicum of support to round out the week. That being said, the exploratory price action beneath the line has assuredly undermined its influence which may see the tech-heavy index fall further.
To that end, secondary and tertiary support may reside around the 6,500 and 5,800 levels respectively – the latter of which marks the index’s 2018 swing low. It is also important to note the index stands on the threshold of oversold territory via RSI –
