

Mexican Peso Technical Price Outlook: USD/MXN Trade Levels
- Mexican Peso updated technical trade levels – Weekly & Daily Charts
- USD/MXN[1] rally stalls at fresh record highs- pullback poised to close below resistance
- Broader long-bias at risk near-term below confluence uptrend resistance / 2017 high
The Mexican Peso posted the fourth consecutive weekly loss against the US Dollar[2] with the losses accelerating this week amid rising fears over the Coronavirus global pandemic. The rally failed at fresh record highs this week with price set to close just below key resistance, well off the highs. These are the updated targets and invalidation levels that matter on the USD[3]/MXN weekly technical chart. Review my latest Strategy Webinar[4] for an in-depth breakdown the setupswe’re tracking this week.
Mexican Peso Price Chart – USD/MXN Weekly
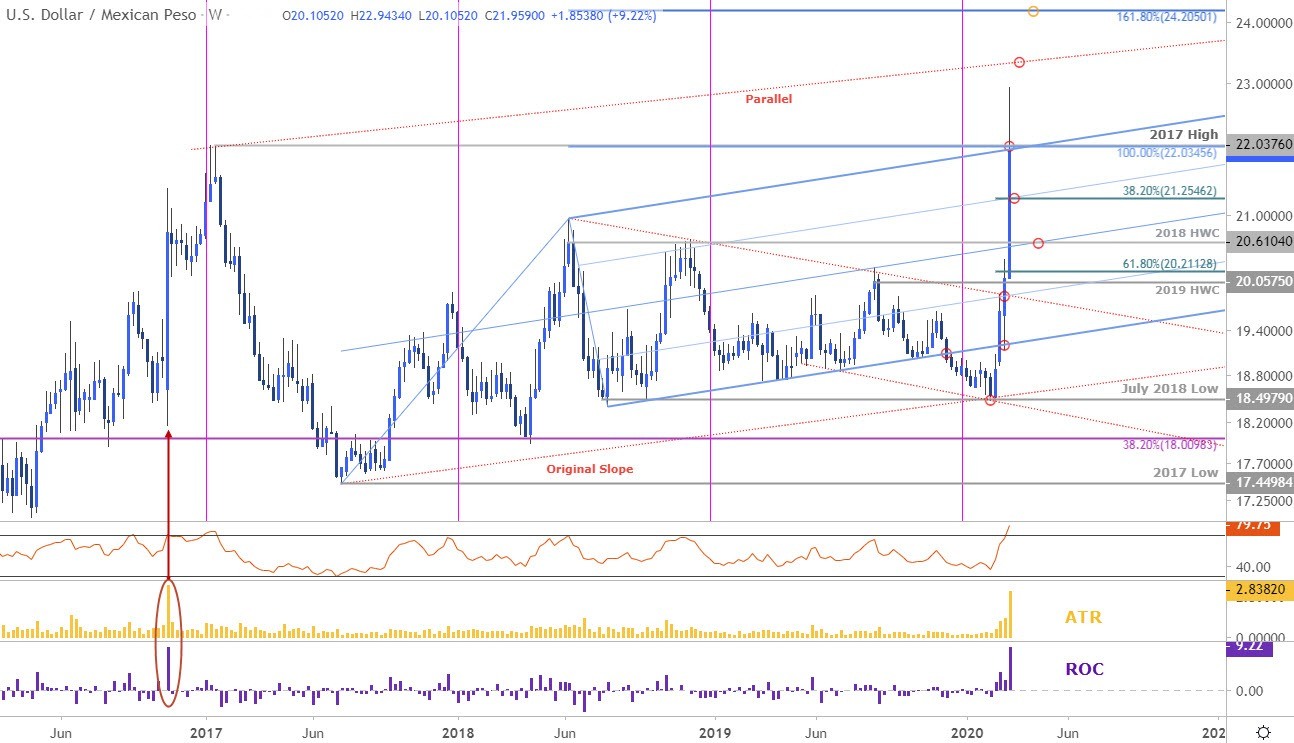
Chart Prepared by Michael Boutros[5], Technical Strategist; USD/MXN on Tradingview[6]
Notes:In my last Mexican Peso Price Outlook[7] we noted that USD/MXN[8] rally had, “responded to a key technical confluence and the immediate USD[9]/MXN rally may be vulnerable IF prices closes below up-slope resistance.” Price registered an intra-week high 22.9434 before reversing sharply on Thursday with USD/MXN trading just below ahead of the New York close on Friday. This week marks the largest weekly range / advance since November 2016 with price deep in overbought territory.
That said, the immediate focus is on the weekly close with respect to confluence resistance at 22.0345/76- a region defined by the 100% extension of the 2017 advance, the 2017 swing high and converges on pitchfork[10] resistance. A close below this would leave the immediate advance vulnerable with initial weekly support eyed at the 38.2%
