

Mexican Peso Technical Price Outlook: USD/MXN Trade Levels
- Mexican Peso updated technical trade levels – Weekly & Daily Charts
- USD/MXN[1] breakout fails at record intraday highs
- Immediate long-bias at risk below uptrend resistance / 2017 high
The Mexican Peso has collapsed vs the US Dollar[2] with a major breakout in USD/MXN[3] taking price into three-year highs. The advance faltered today just pips above a key resistance range before pulling back and while the broader outlook remains tilted to the topside, the immediate advance may be vulnerable while below this threshold . These are the updated targets and invalidation levels that matter on the USD[4]/MXN weekly price chart. Review my latest Strategy Webinar[5] for an in-depth breakdown the setupswe’re tracking this week.
Mexican Peso Price Chart – USD/MXN Weekly
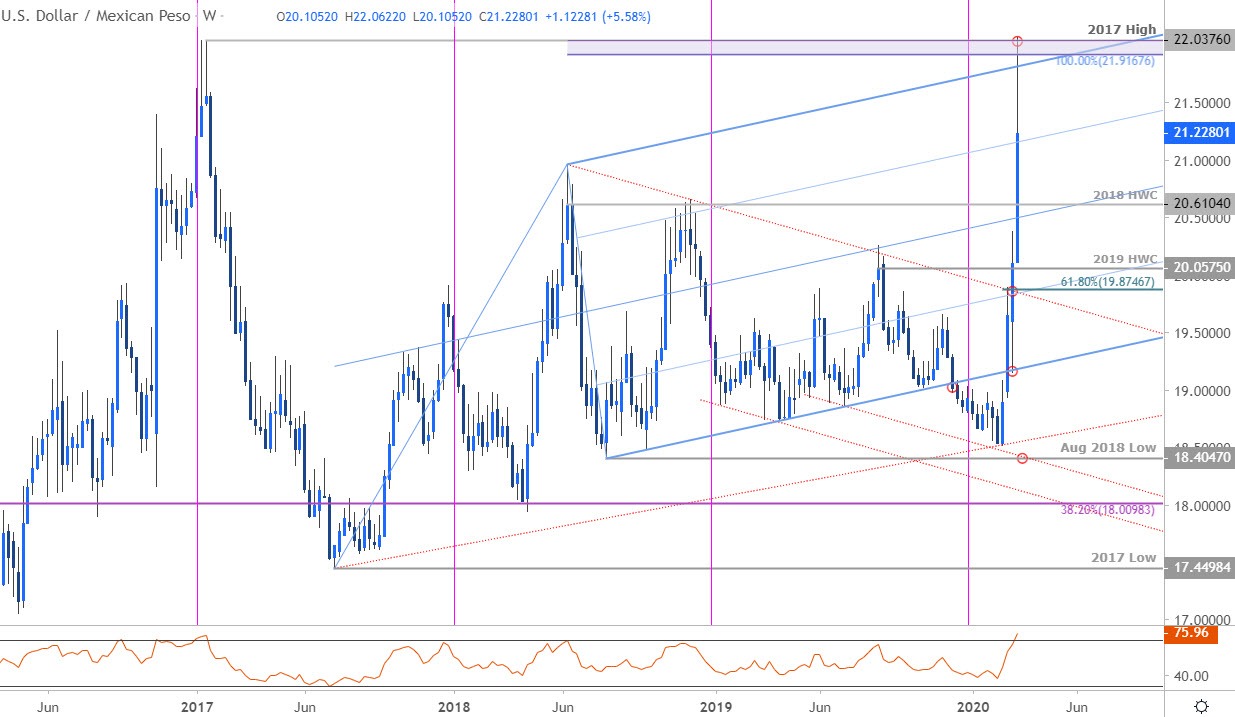
Chart Prepared by Michael Boutros[6], Technical Strategist; USD/MXN on Tradingview[7]
Notes: In my last Mexican Peso Price Outlook[8] we noted that USD[9]/MXN was, “broad consolidation formation since the start of the year and we’re looking for a reaction here- from a trading standpoint, the immediate focus is on a breakout of the January range for guidance..” A topside breach of the yearly opening-range highs into the close of February fueled a rally of more than 19% off the yearly lows.
The advance failed today on this last stretch at a key resistance threshold at 21.9167–22.0376 – a region defined by the 2017 high and the 100% extension of the 2017 advance. Note that the upper parallel of an ascending pitchfork[10] formation comes in just lower and although price saw an intraweek breach, the focus remains on the weekly close in relation to
