

Gold Price Analysis
- Gold prices[1] gapped-higher to start this week.
- Fear drove the bid in Gold through last week.
- Gold price action has started pulling back, finding support at a Fibonacci level.
Gold Price Action Begins Pullback, Finds Fibonacci Support
It’s turning into a nasty week for Gold bulls, even after the yellow metal gapped-up to fresh highs on the Sunday open. Sellers came in and haven’t relented much as price action has fallen by almost 3% so far this week; and this follows the bullish bounce after last week’s FOMC[2] rate decision. There remains considerable headline risk for the rest of this week, with Friday’s NFP[3] report looming large, and also the ongoing-yet-difficult to navigate Coronavirus, which can bring a fear bid back into Gold at any time.
At this point, Gold prices are finding support at a Fibonacci level of interest, as this is the 38.2% retracement of the November-January major move. This was looked at as secondary support in Gold last week[4], just ahead of the FOMC bump; and a week later this level has come back into play with a slightly different context.
Gold Four-Hour Chart
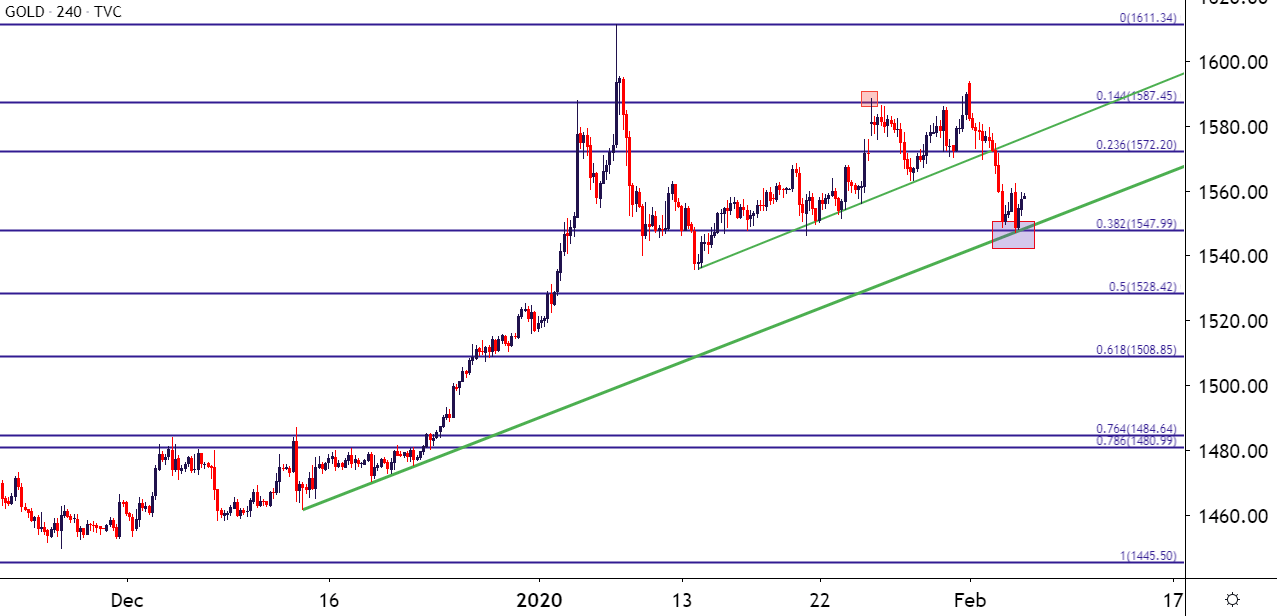
Chart prepared by James Stanley[5]; Gold on Tradingview[6]
As looked at previously, there are a few bullish factors driving Gold prices, most recently of which has been the build of fear around the continued spread of Coronavirus. As those fears have dissipated in the early-portion of this week, further evidenced by the recovery in Oil[7] prices and the ascension of US equities back towards all-time-highs, Gold prices have folded lower to erase prior gains.
There still remains items of interest for Gold buyers, however, chief
