

Bitcoin (BTC), Ethereum (ETH), Litecoin (LTC) Price Forecast, Analysis and Chart:
If you are interested in trading the cryptocurrency market, we have produced a Day Trading Guide to Bitcoin and Other Cryptocurrencies[2]to help you better understand this highly volatile asset class.
Cryptocurrency Rally Continues
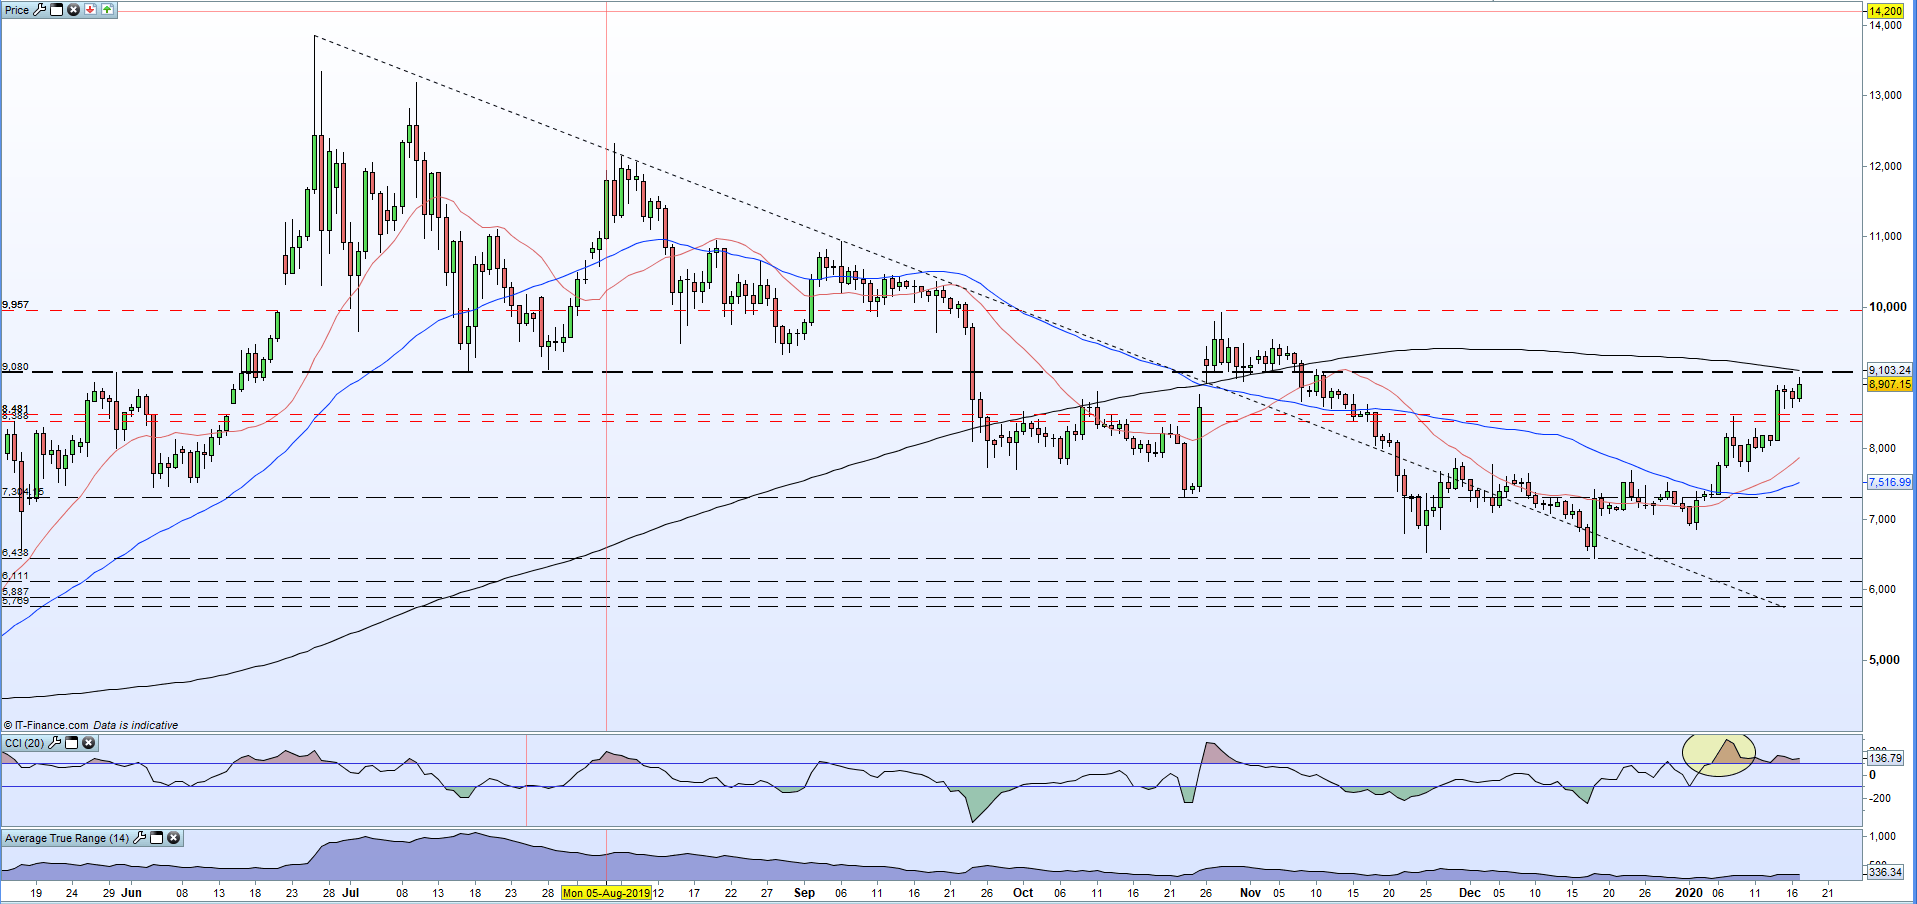
The two-month cryptocurrency rally continues Friday with all major coins/tokens in positive territory. Market leader Bitcoin has just touched the $9,000 level and made its highest level since November 11, while Ethereum[3] is back at levels last seen two months ago.

Coinmarket.Cap
We have produced a series of cryptocurrency reports recently, highlighting notable technical set-ups and important price points.
Ripple, Ethereum Face Key Technical Levels – XRP/USD and ETH/USD Price Outlook[4]
Litecoin (LTC) Price Analysis: Bullish Breakout or Fake Break?[5]
Bitcoin Chart Exposes Key Reversal Signals – BTC/USD Price Forecast[6]
Bitcoin’s latest run, while fueling bullish sentiment, needs to break a couple of important technical levels to turn the chart further positive. A break of the 200-day moving average, currently around $9,100, would confirm short-, medium- and long-term positive sentiment, while a close above $9,930 would break a series of lower highs and add further bullish sentiment. Initial support either side of $8,500.
As always with this sector, sharp moves either way can occur in a short timeframe, and with the market trading 24/7, care should be taken over the weekend.
Bitcoin (BTC) Daily Price Chart (May 2019 - January 17, 2020)
Traders may be interested in two of our trading guides – Traits of Successful Traders[7] and Top Trading Lessons[8] – while technical analysts are likely to be interested in our latest
