

EUR/USD[1] volatility is making getting a clear handle on anything a bit tricky, as the slow grind since the low since the fall has an upward trend intact, but within the context of a broader downtrend. This inclines me to believe it is corrective and that eventually a breakdown below the multi-month trend-line will materialize. But it may not come before we see some more backing and filling to the upside. Things are a bit tricky at the moment, so taking it slow. It seems, though, a move towards the 10900 area could be in store in the not-too-distant future.
EUR/USD Daily Chart (choppy, watch t-line)
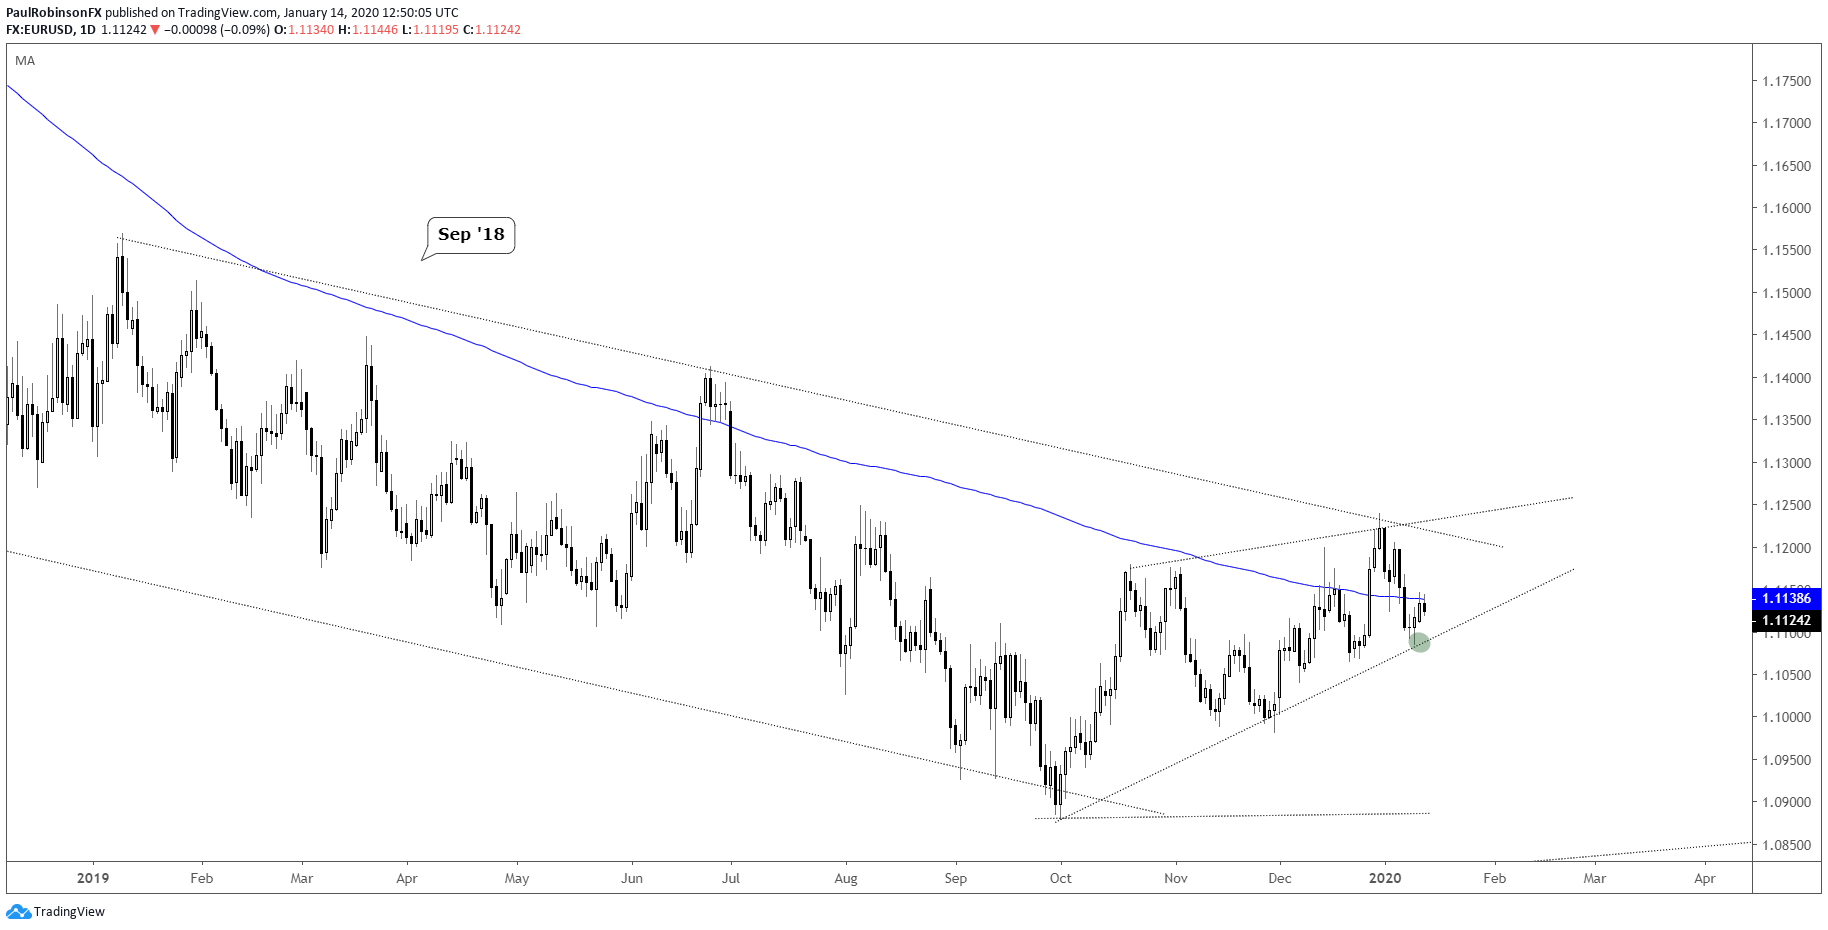
EUR/USD Chart by TradingView[2]
The US Dollar[3] Index (DXY), largely driven by the Euro[4], is up against trend-line resistance that could be part of a falling wedge formation. If this is to be the case, then at some point now or a little later on (next couple of weeks) we should see a surge higher develop. For now, respecting the downtrend line. A break above the trend-line and 97.82 is needed to get the chart tilted to the upside.
US Dollar Index (DXY) Daily Chart (falling wedge developing, t-line resistance)
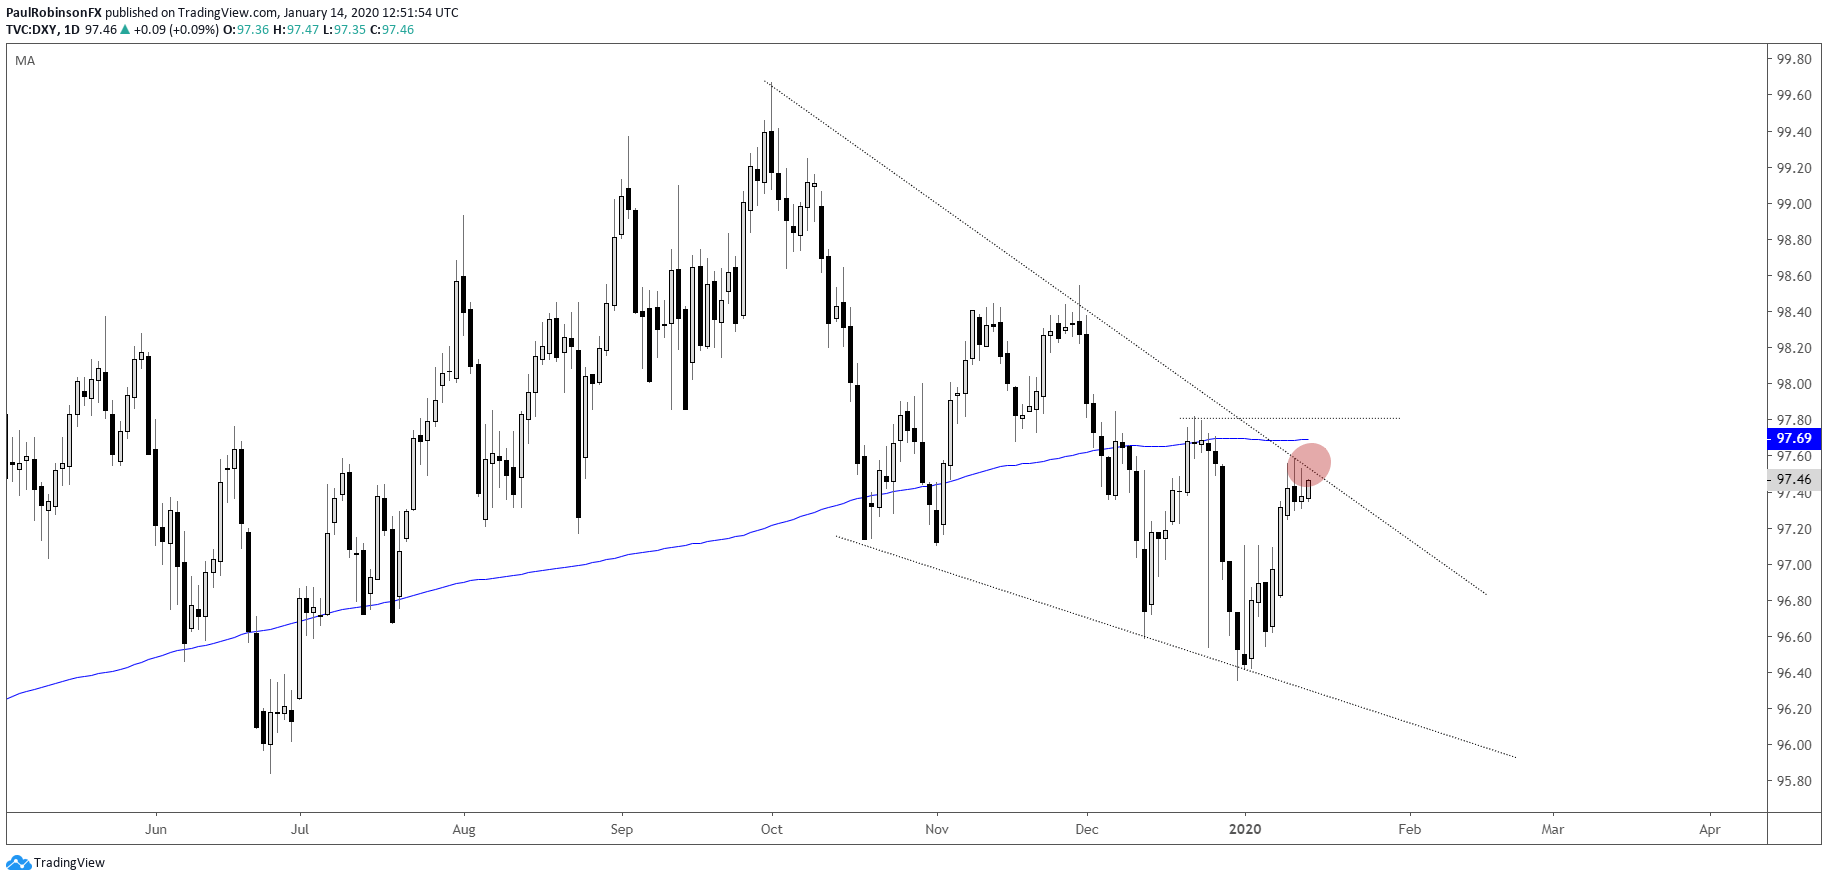
US Dollar Index (DXY) Chart by TradingView[5]
USD/JPY[6] broke above the October 2018 trend-line and late-year peaks around the 10972-line, but are already in a battle with another level of resistance. The trend-line from 2015 is running down over today’s high. This puts a bit of a damper on seeing more strength, but the general backdrop doesn’t necessarily make this a great spot to be a bear either. It appears likely that we see a bit of back-and-forth between levels before a resolution in direction.
