

The Australian Dollar[1] is already down more than 1% against US Dollar[2] since the start of the week with Aussie[3] falling for the second consecutive week after turning from a pivotal resistance zone into the start of the year. While further losses are likely, we’re looking for exhaustion on this decline IF the broader October advance is to remain viable. These are the updated targets and invalidation levels that matter on the AUD[4]/USD[5] weekly chart. Review my latest Weekly Strategy Webinar[6] for an in-depth breakdown of this Aussie price setup and more.
Australian Dollar Price Chart – AUD/USD Weekly
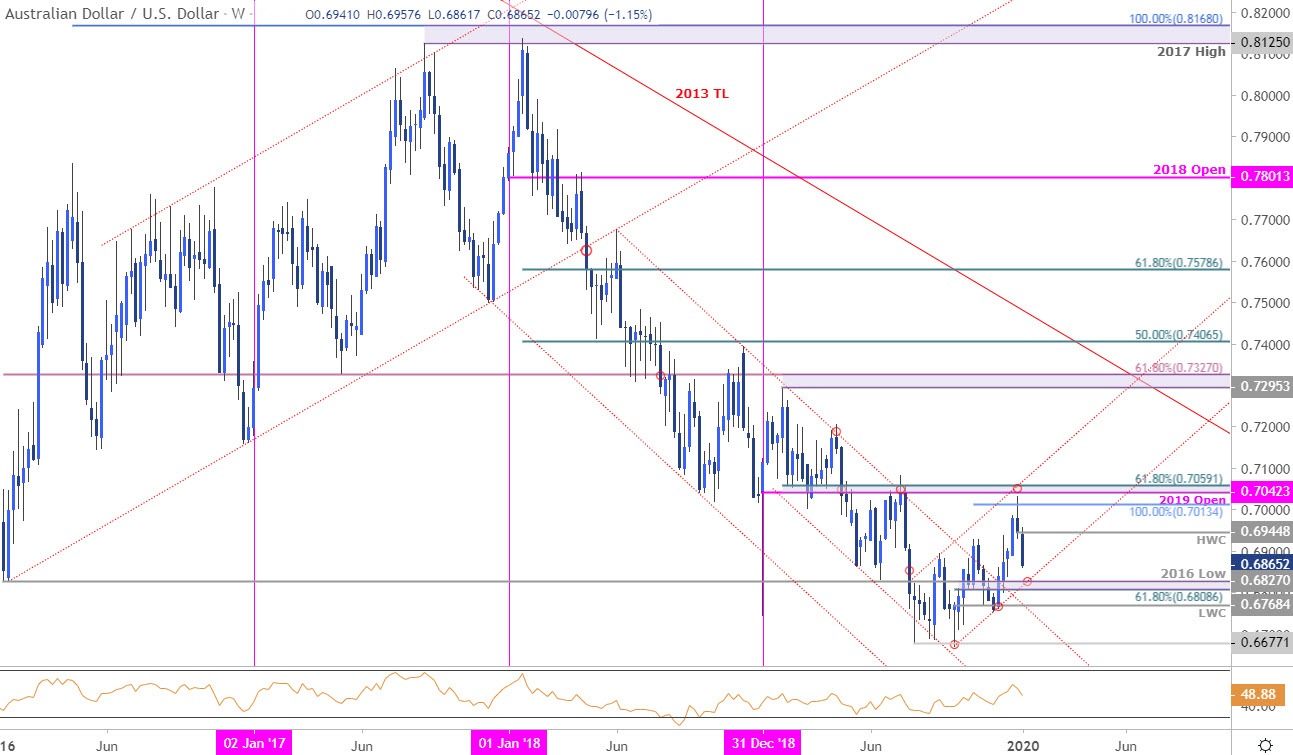
Chart Prepared by Michael Boutros[7], Technical Strategist; AUD/USD on Tradingview[8]
Notes: In my last Australian Dollar Weekly Price Outlook[9] we noted, “topside targets eyed at 7013 and the 2019 objective yearly open / 61.8% retracement at 7042/59(critical).” Price registered a high at 7032 last week before posting a weekly-reversal to snap a four-week winning streak. The move leaves the near-term risk lower, but price would need to hold this channel to remain constructive deeper into January trade.
Initial support eyed at the September trendline around ~6809/27- a region defined by the 2016 low and the 61.8% retracement[10] of the September advance. Broader bullish invalidation for the breakout rests with the 2019 low-week close at 6768. Initial resistance stands with the high-week reversal close at 6945- a breach / close above there would be needed to shift the focus back towards 7013 and 7042/59.
For a complete breakdown of Michael’s trading strategy, review his Foundations of Technical Analysis series on Building a Trading Strategy[11]
Bottom line: The Australian
