

Gold Price Forecast Talking Points:
- Gold prices[1] have started 2020 in a very similar manner to last summer’s theme of strength.
- Gold has hit a fresh six-year-high, finding a bit of resistance around a long-term Fibonacci level before pulling back. At this point, support has showed at prior resistance, taken from last year’s high. But are bulls ready to continue to drive despite overbought short-term conditions? As looked at in this year’s ‘Top Ideas,’[2] the bullish side of Gold can remain of interest given the economic and geopolitical backdrops.
Gold Prices Breakout Again, Furthering 2019 Theme of Strength
Gold prices have started 2020 very similar to the net outlay from 2019. Gold came into last year clinging to a bullish trend that had started from August 2018 lows. As expectations for a softer FOMC[3] drove asset prices in Q1, a bullish breakout showed up in Gold that drove prices to fresh highs, with a bit of resistance showing around the 1345 level. After a three-month break in which a falling wedge formation showed up, an aggressive breakout took over in June and lasted into early-September, at which point Gold prices hit a fresh six-year-high at 1557.10.
But, as documented in these articles numerous times, that bullish breakout remained on hold through the end of September and the bulk of Q4, allowing for the build of a symmetrical wedge formation[4], only starting to give way as the holiday neared.
Gold Daily Price Chart
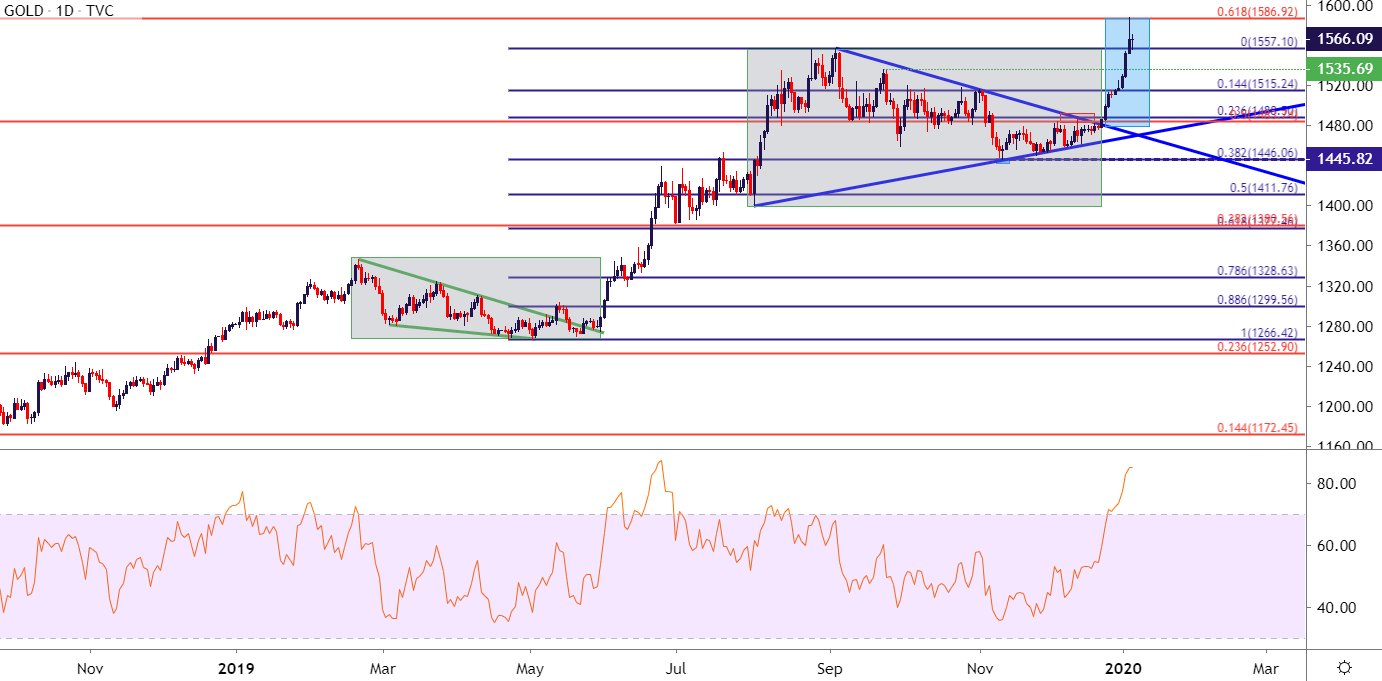
Chart prepared by James Stanley[5]; Gold on Tradingview[6]
Gold prices began to work outside of this wedge formation on December 23rd, with the theme getting a shot-in-the-arm a day later. Since then, bulls have
