

The US Dollar[1] Index (DXY) is flirting with a significant breakdown from the channel it has been stuck in since last year. Further adding to the mix here is that volatility has been extremely suppressed and this could be a sign that this about to change as we head towards a calendar flip. The initial bias with a little bit more weakness to confirm, will be lower, but it would be unsurprising if it turned out to be a fake-break. Nevertheless, it is a good sign that a once steady technical structure may be no more.
US Dollar Index (DXY) Weekly Chart (Channel on verge of snapping)

US Dollar Index Chart by TradingView[2]
GBP/USD[3] put on a show last night following the exit polls from the UK general election, with it rallying well over 3 big figures at one point. It has since eased off a bit and could be exhausted in the near-term with ‘buy-the-rumor’ sell the news risk rising. With that in mind, taking a somewhat neutral stance here to see how things settle out. There is a trend-line running over from September 2018 that the overnight high pretty much tagged to a “T”, keep an eye on its influence going forward.
GBP/USD Daily Chart (burst higher may have Cable exhausted)
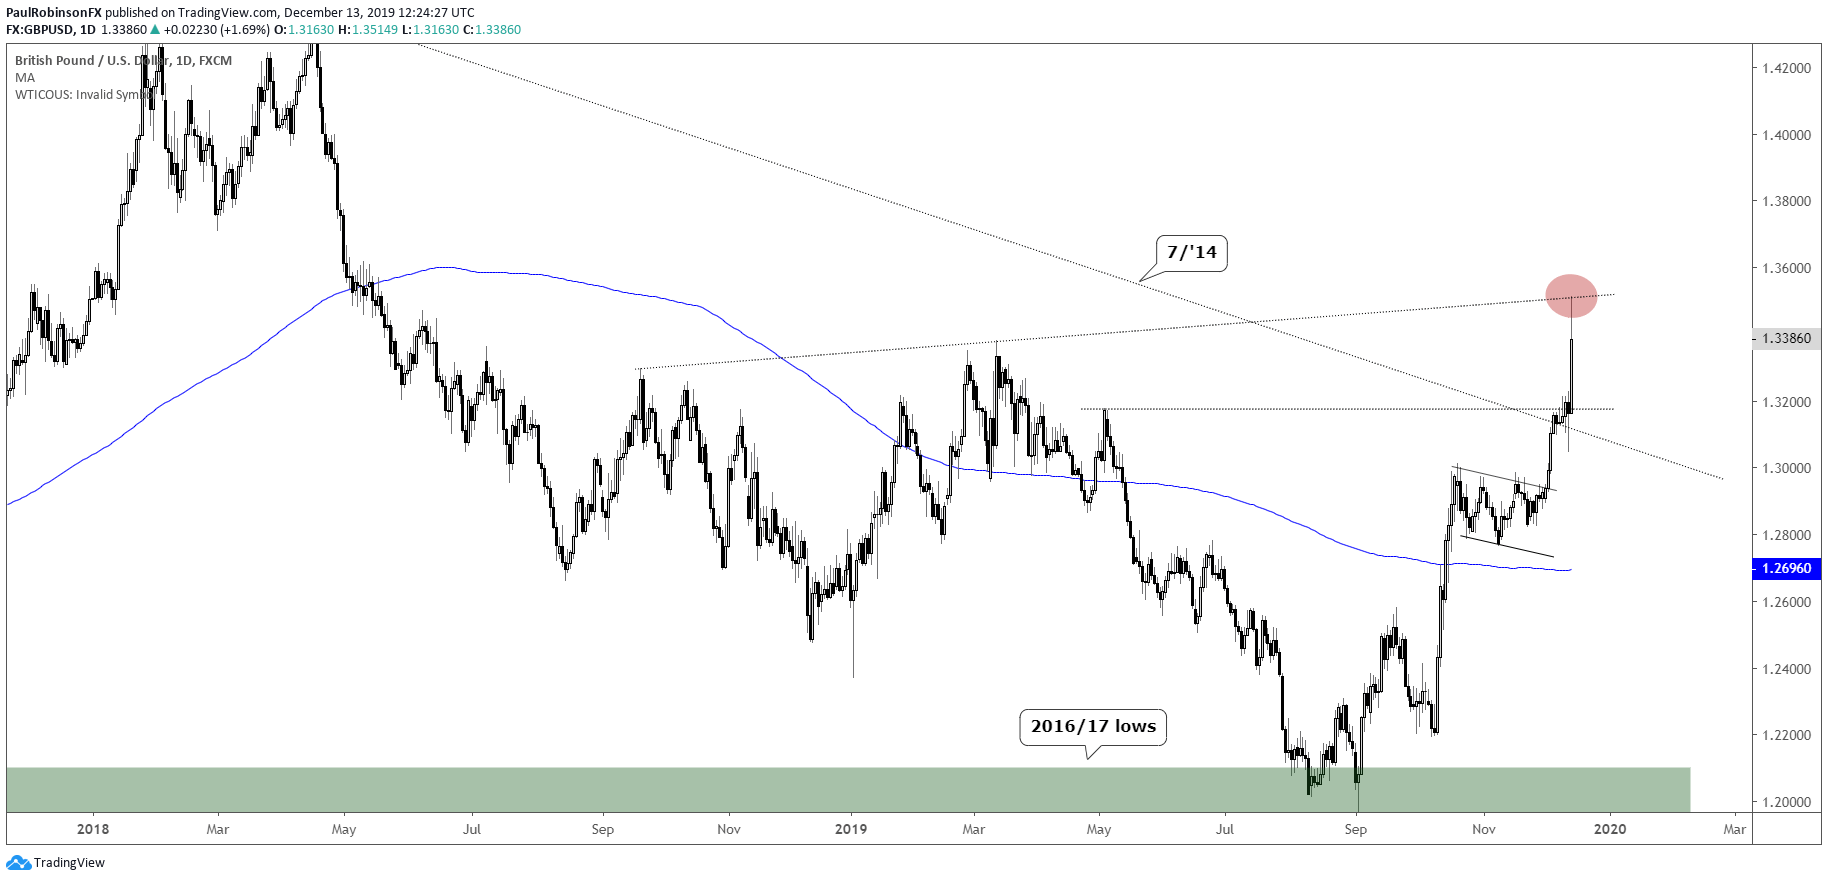
GBP/USD Chart by TradingView[4]
EUR/USD[5] is trying to make a break for it, and if the DXY is going to make good on its breakdown then the Euro[6] will need to follow through. Right now, price is above the 200-day and September 2018 trend-line, but there needs to be a rally with conviction beyond say the 11300/11400-area before a trend change can grow legs. For now watching to see how this
