

The Japanese Yen[1] is down more than 0.65% against the US Dollar[2] this week with USD[3]/JPY[4] rallying back towards a critical resistance zone we’ve been tracking for months now. These are the updated targets and invalidation levels that matter on the USD[5]/JPY weekly price chart. Review my latest Weekly Strategy Webinar[6] for an in-depth breakdown of this gold price[7] setup and more.
Japanese Yen Price Chart – USD/JPY Daily
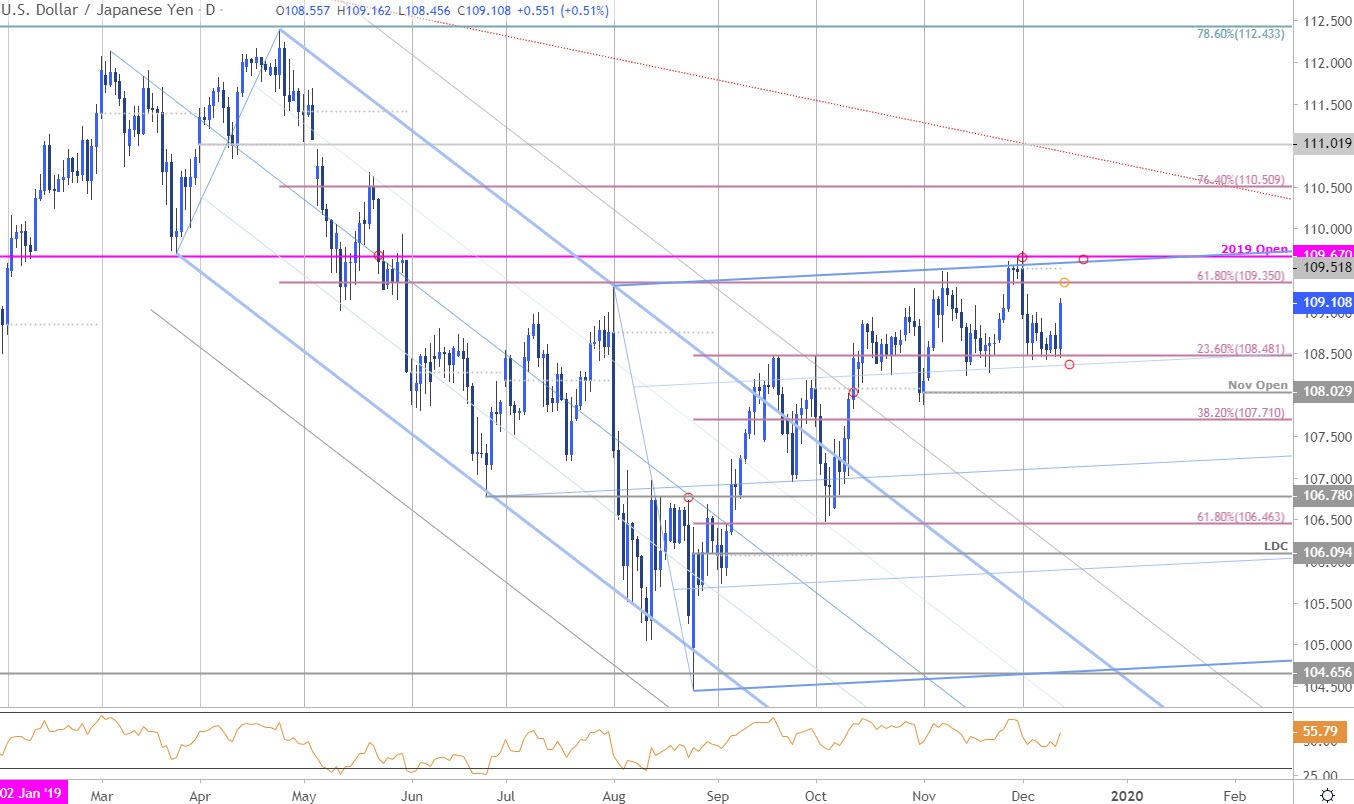
Chart Prepared by Michael Boutros[8], Technical Strategist; USD/JPY on Tradingview[9]
Notes: In my latest Japanese Yen Weekly Price Outlook[10] we noted that USD/JPY was, “once again testing critical yearly open resistance at 109.68 and we’re looking for a reaction.” Price registered a high at 109.72 before reversing sharply lower with the decline rebounding off Fibonacci[11] support at the 23.6% retracement of the August advance at 108.48. Price is poised to mark an outside daily-reversal candle off this threshold today with USD/JPY again targeting the 61.8% retracement at 109.35. Note that daily RSI has continued to hold above the 40-threshold since the August lows and keeps the broader momentum profile on the side of the bulls for now.
Japanese Yen Price Chart – USD/JPY 120min
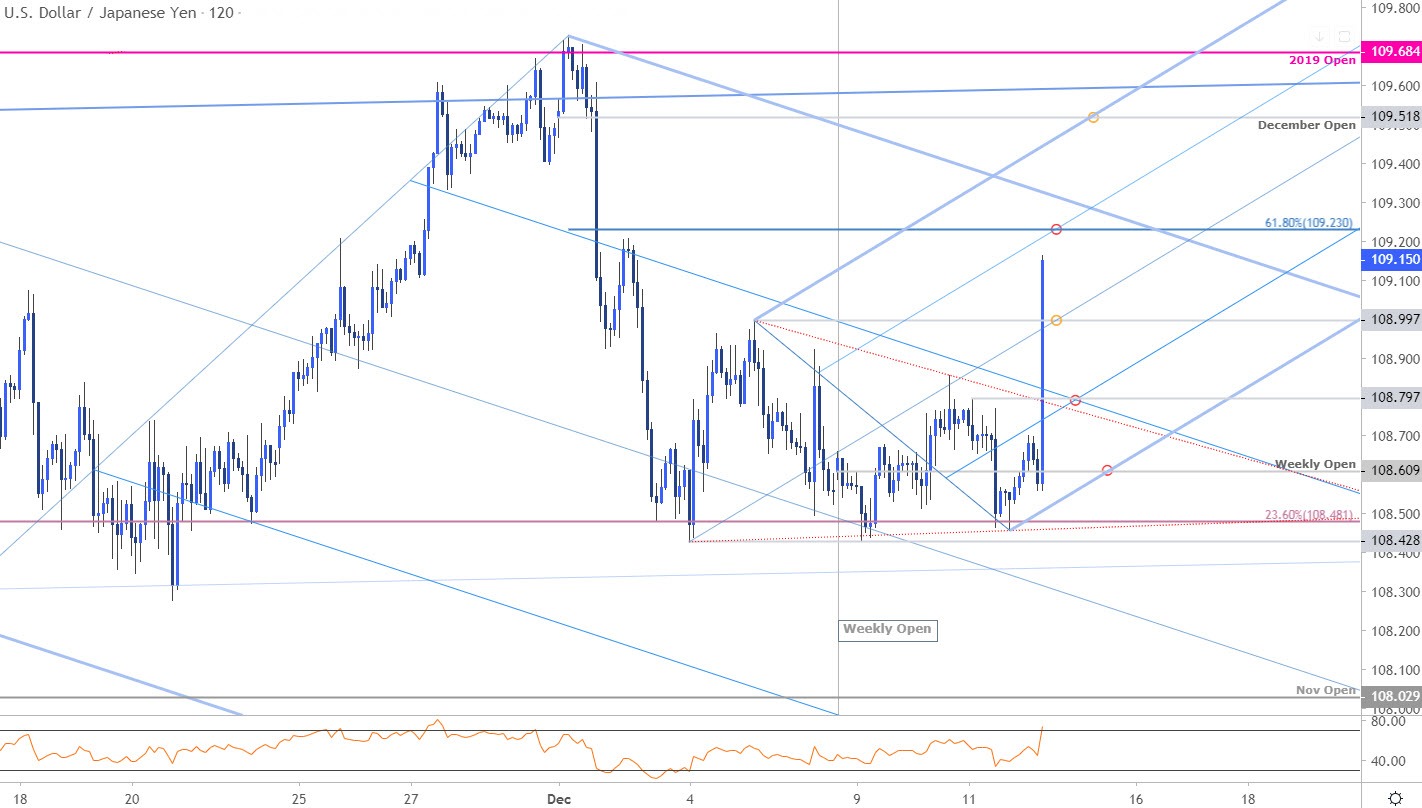
Notes: A closer look at Japanese Yen price action shows USD/JPY trading within the confines an ascending pitchfork[12] formation extending off the monthly lows. A topside breach of the weekly opening-range[13] today keeps the focus on topside resistance targets at 109.23 backed by broader downtrend slope resistance near ~109.30s – look for a reaction / possible exhaustion there IF reached.
Initial support now rests at the
