The Dow Jones[1] is sitting at record highs and in the absence of bearish price action it has more room to go before running into a potential obstacle. A few hundred points ahead lies the top-side parallel of an upward sloping channel. There are three inflection points on both sides of the structure, making it a sound one.
The top of the channel won’t necessarily stop the market from continuing to rise, but is certainly a spot, if reached, to watch for bearish price action to develop. A strong reaction, for example a 1-2% down day, could set into motion a decline. A pullback from current levels will have the January 2018 trend-line in focus as support.
For now, it’s a tough spot to initiate fresh longs, and even tougher for shorts. For those running with longs from good prices, it may hold beneficial to hold tight until sellers show up.
.
Dow Jones Daily Chart (support/resistance lines to watch, in between for now)
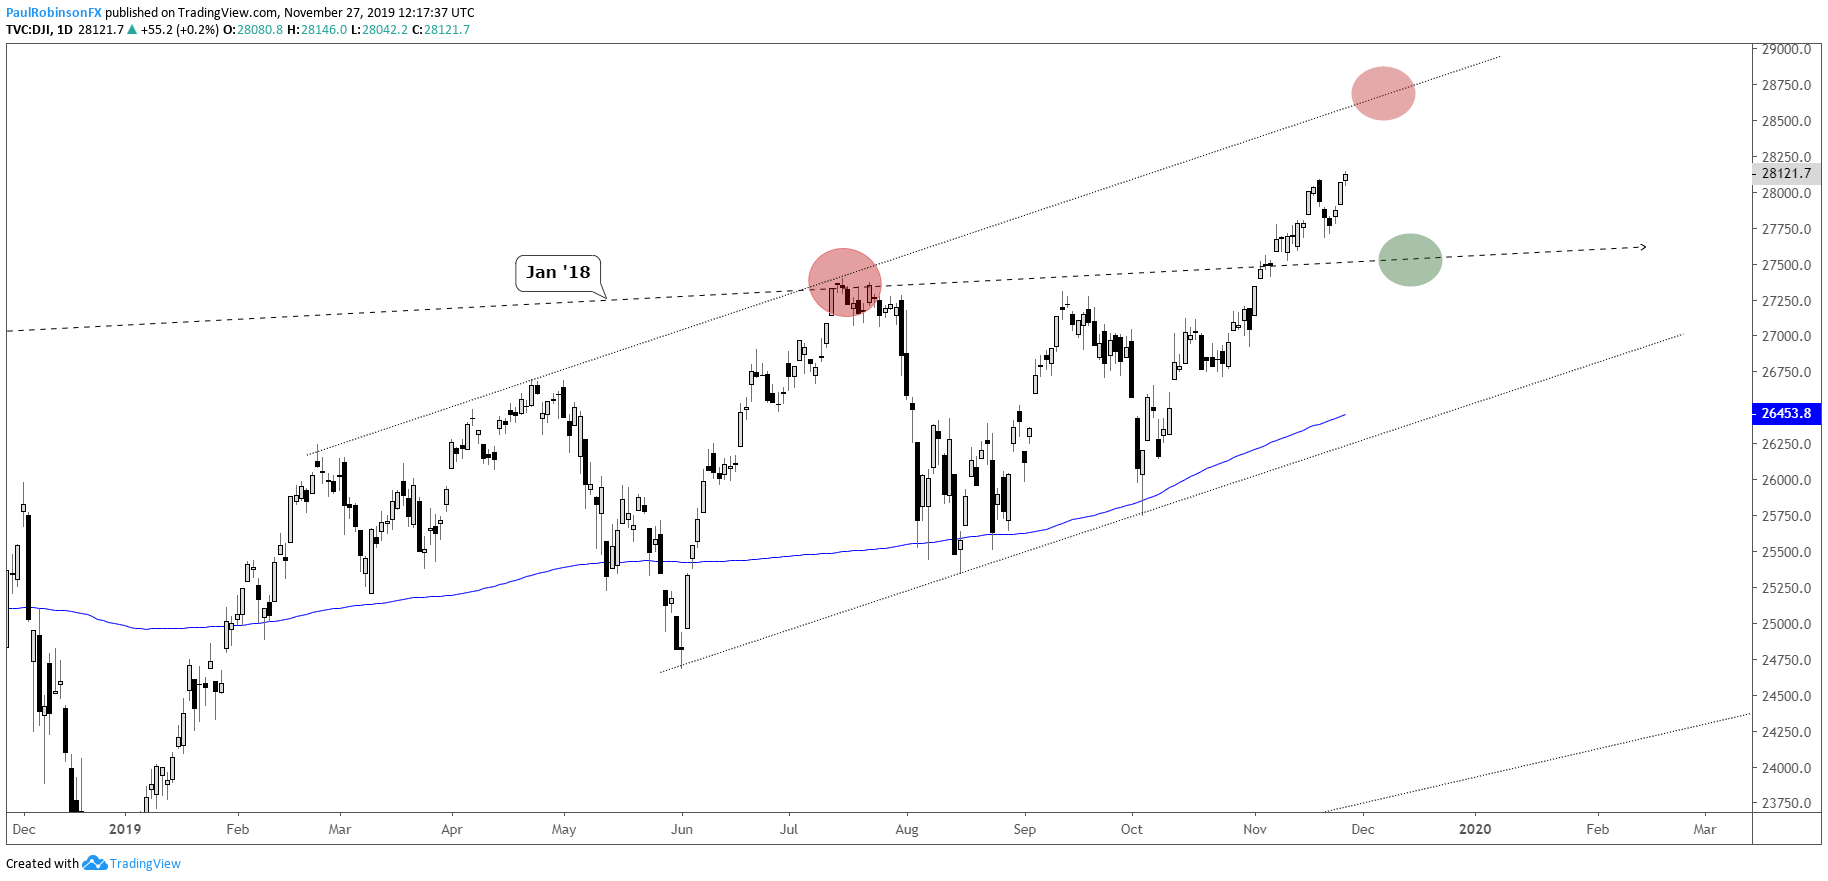
Dow Jones Chart by TradingView[2]
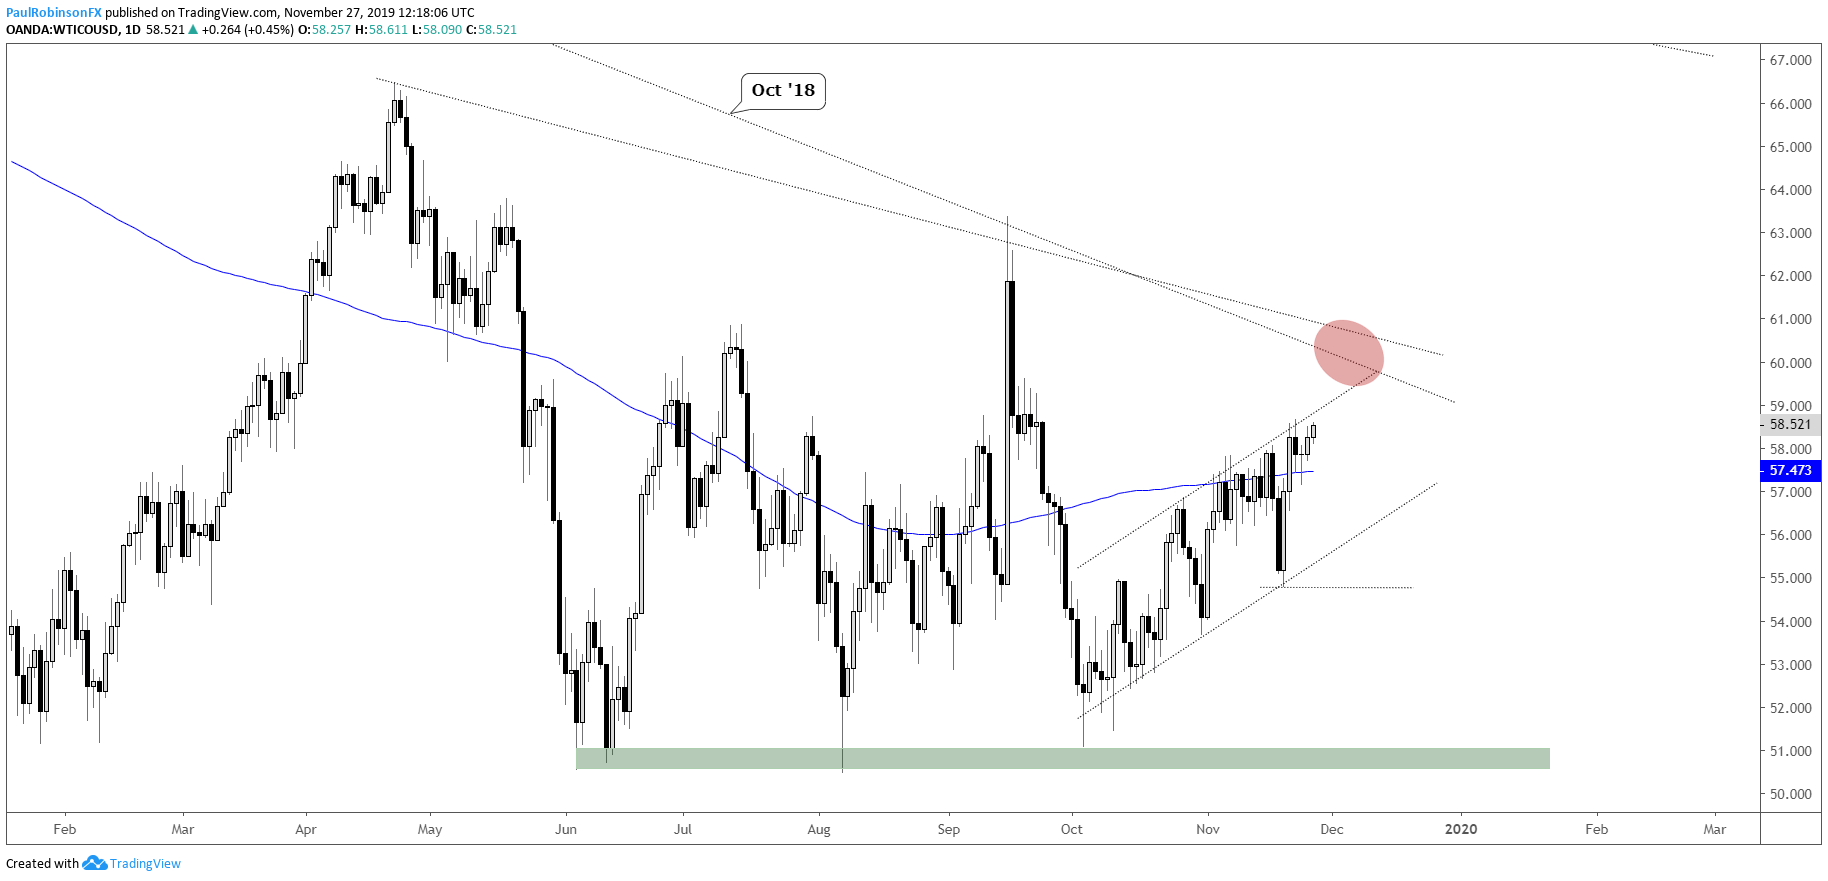
Crude oil[3] is a difficult handle, no question. It has held little directional flow and doesn’t seem like it is set to have any for the foreseeable future. Traders will likely be best served fading levels until conditions change. Right now, WTI is up against the top of a multi-week channel, which may mean another turn down is coming soon. If price can sneak out of the channel, then look for it to be a short run before trend-lines come into play as resistance. On the downside, keep the bottom of the channel in mind as support for potential longs.
Crude Oil Daily Chart (choppy inside channel)