

Gold Price Talking Points:
- Gold prices[1] have been in a one-sided trend over the past week, taking a trip from short-term resistance back down to a key zone of support.
- While the pullback/sell-off has now been going on for three full months, the longer-term backdrop remains bullish as this has only retraced 38.2% of that prior topside trend.
- DailyFX Forecasts are published on a variety of markets such as Gold[2], the US Dollar[3] or the Euro[4] and are available from the DailyFX Trading Guides page[5]. If you’re looking to improve your trading approach, check out Traits of Successful Traders[6]. And if you’re looking for an introductory primer to the Forex market, check out our New to FX Guide[7].
Gold Prices Grind at Support
Gold prices are closing in on their third full month of pullback following the blistering bullish trend from this summer. After Gold topped-out above the 1550 level in early-September, buyers have been held at bay as price action has digested those prior gains. And given the length of the pullback, now almost a full three months, it can be easy to forget about the topside momentum that was carrying prices higher earlier this year.
But at this stage, price action remains supported at a key area on the chart[8] and the past three months have been but a 38.2% Fibonacci retracement of the summer breakout. This keeps the longer-term look at Gold prices as bullish, although timing remains of issue.
Gold Daily Price Chart
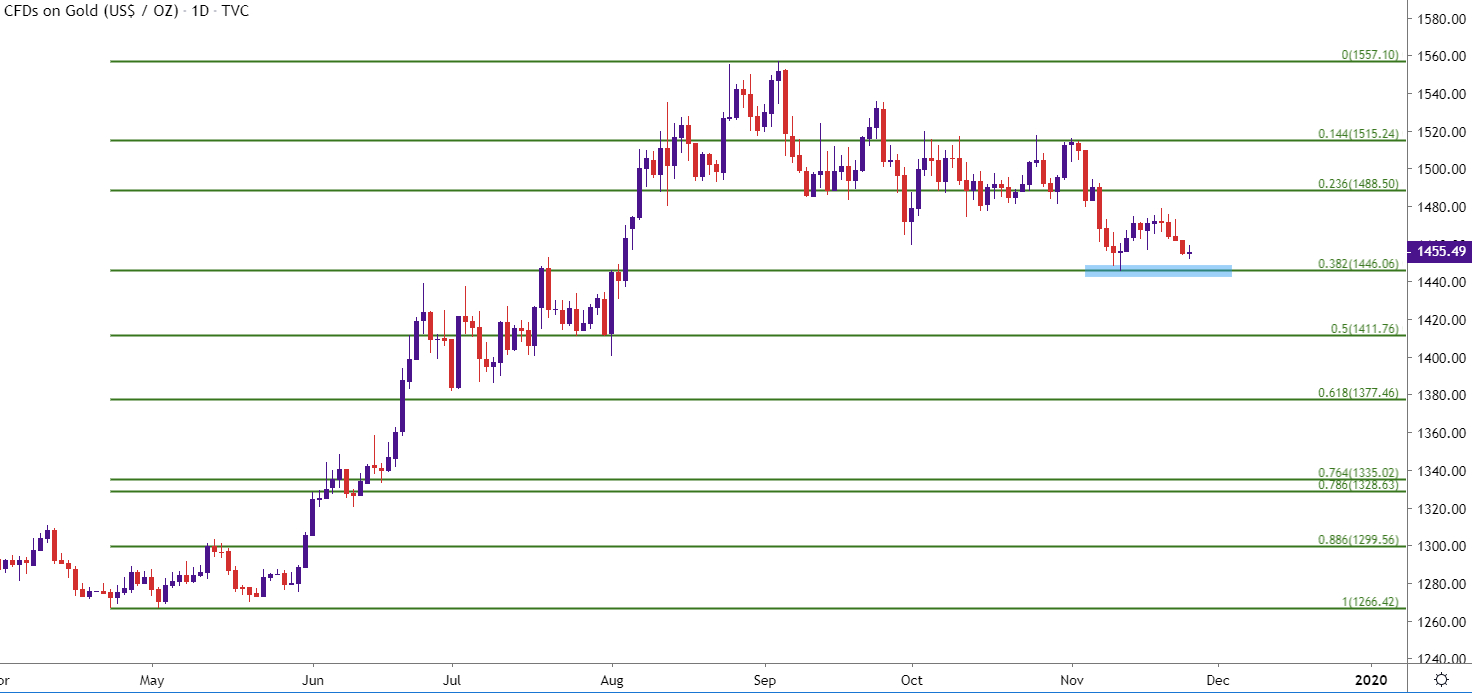
Chart prepared by James Stanley[9]; Gold on Tradingview[10]
Taking a step back and incorporating some longer-term technical items, and this current
