

Crude Oil prices[1] surged more than 6% over the past two days with WTI poised to test a key weekly resistance barrier just higher. These are the updated targets and invalidation levels that matter on the oil price[2] weekly chart. Review my latest Weekly Strategy Webinar[3] for an in-depth breakdown of this Loonie[4] price setup and more.
New to Oil Trading? Get started with this Free How to Trade Oil -Beginners Guide[5]
Crude Oil Price Chart – WTI Weekly
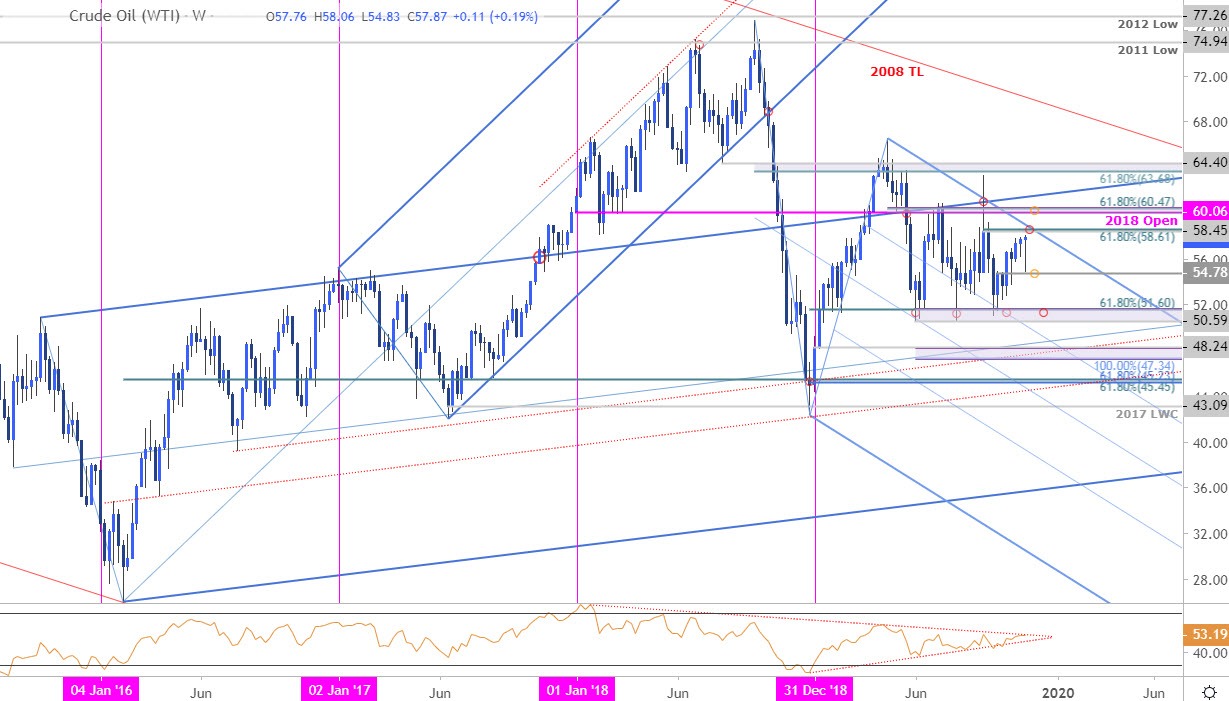
Chart Prepared by Michael Boutros[6], Technical Strategist; Crude Oil (WTI) on Tradingview[7]
Notes: In my previous Oil Weekly Price Outlook[8] we noted that WTI had, “been testing this key support barrier since June and while the broader risk remains lower, the short-bias remains vulnerable while above the 51-handle.” The support zone in focus was 50.59-51.60 – a region defined by the June swing low and the 61.8% retracement of the December advance. The September low at 50.97 held into the October close with the subsequent recovery now approaching key confluence resistance.
The immediate focus is on reaction at 58.45/61- where the 61.8% retracement[9] and the September high-week close converges on parallel[10] resistance. A breach / close above this threshold is needed to keep the long-bias viable targeting more critical resistance at 2018 open / 61.8% retracement of the April decline at 60.06/47. Initial weekly support rests with the October reversal close at 54.78 with critical support steady at 50.59-51.60.
For a complete breakdown of Michael’s trading strategy, review his Foundations of Technical Analysis series on Building a Trading Strategy[11]
Bottom line: Crude oil prices are approaching confluence downtrend resistance just
