

Gold Price Talking Points:
- Gold prices[1] have bounced over the past week after an aggressive sell-off to start the month of November.
- The longer-term bullish trend remains in-tact, however, as that early-November sell-off[2] found support at the 38.2% Fibonacci retracement of the summer breakout. Timing the return of that bullish trend is the current objective.
- DailyFX Forecasts are published on a variety of markets such as Gold[3], the US Dollar[4] or the Euro[5] and are available from the DailyFX Trading Guides page[6]. If you’re looking to improve your trading approach, check out Traits of Successful Traders[7]. And if you’re looking for an introductory primer to the Forex market, check out our New to FX Guide[8].
Gold Prices Recovery After Early-November Spill
Gold prices have displayed a tone of recovery over the past week after starting November on a very sour note. As risk rallies were showing across a number of global markets, the fear bid left Gold, at least temporarily, as prices dropped down to fresh three-month-lows, eventually finding support at the 38.2% Fibonacci retracement of the summer breakout.
Gold Daily Price Chart: Three-Month-Lows at 38.2% Fibonacci Retracement
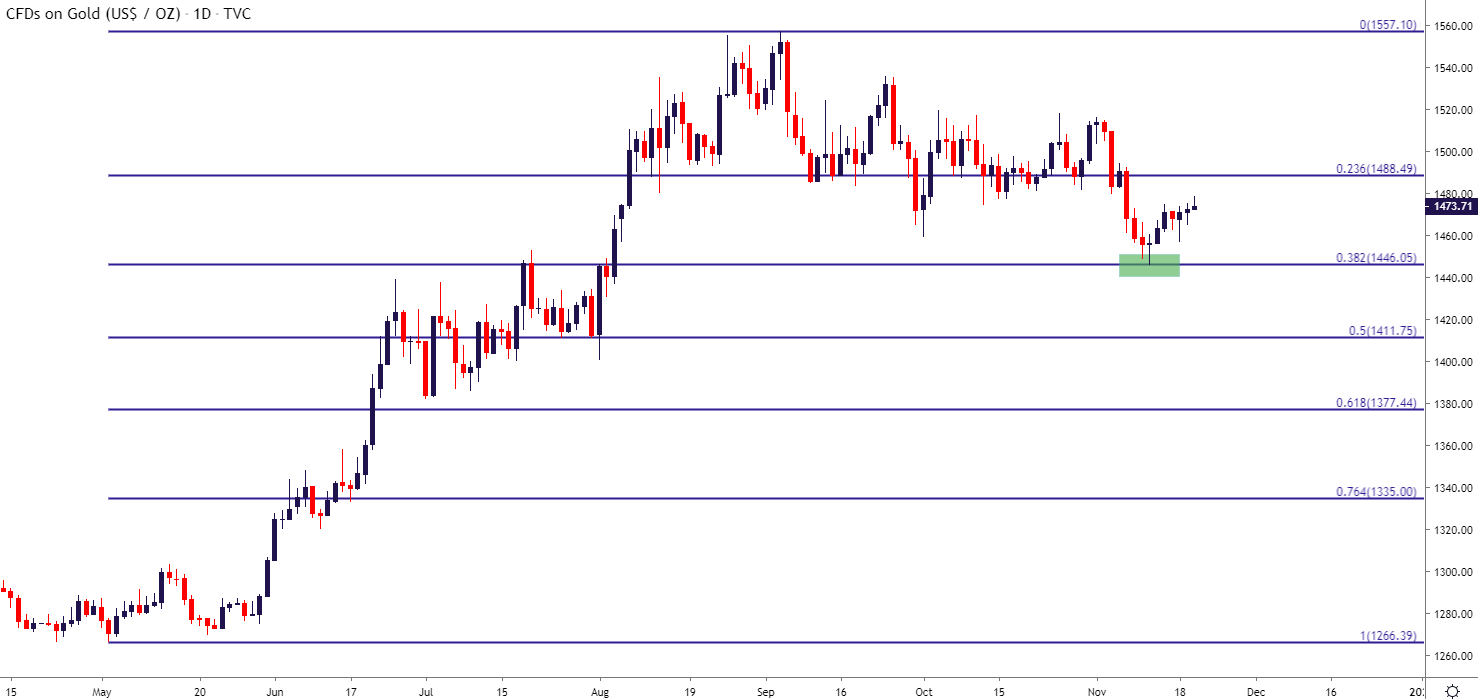
Chart prepared by James Stanley[9]; Gold on Tradingview[10]
Adding some additional context into the matter and a couple of zones discussed in these Gold technical pieces[11] have recently come into play to help guide that move.
Around support has been a zone that runs from the July swing-high of 1453 up to the October swing-low around 1460. Given that there were no daily closes below this zone and merely an interaction followed by a bullish bounce, that
