

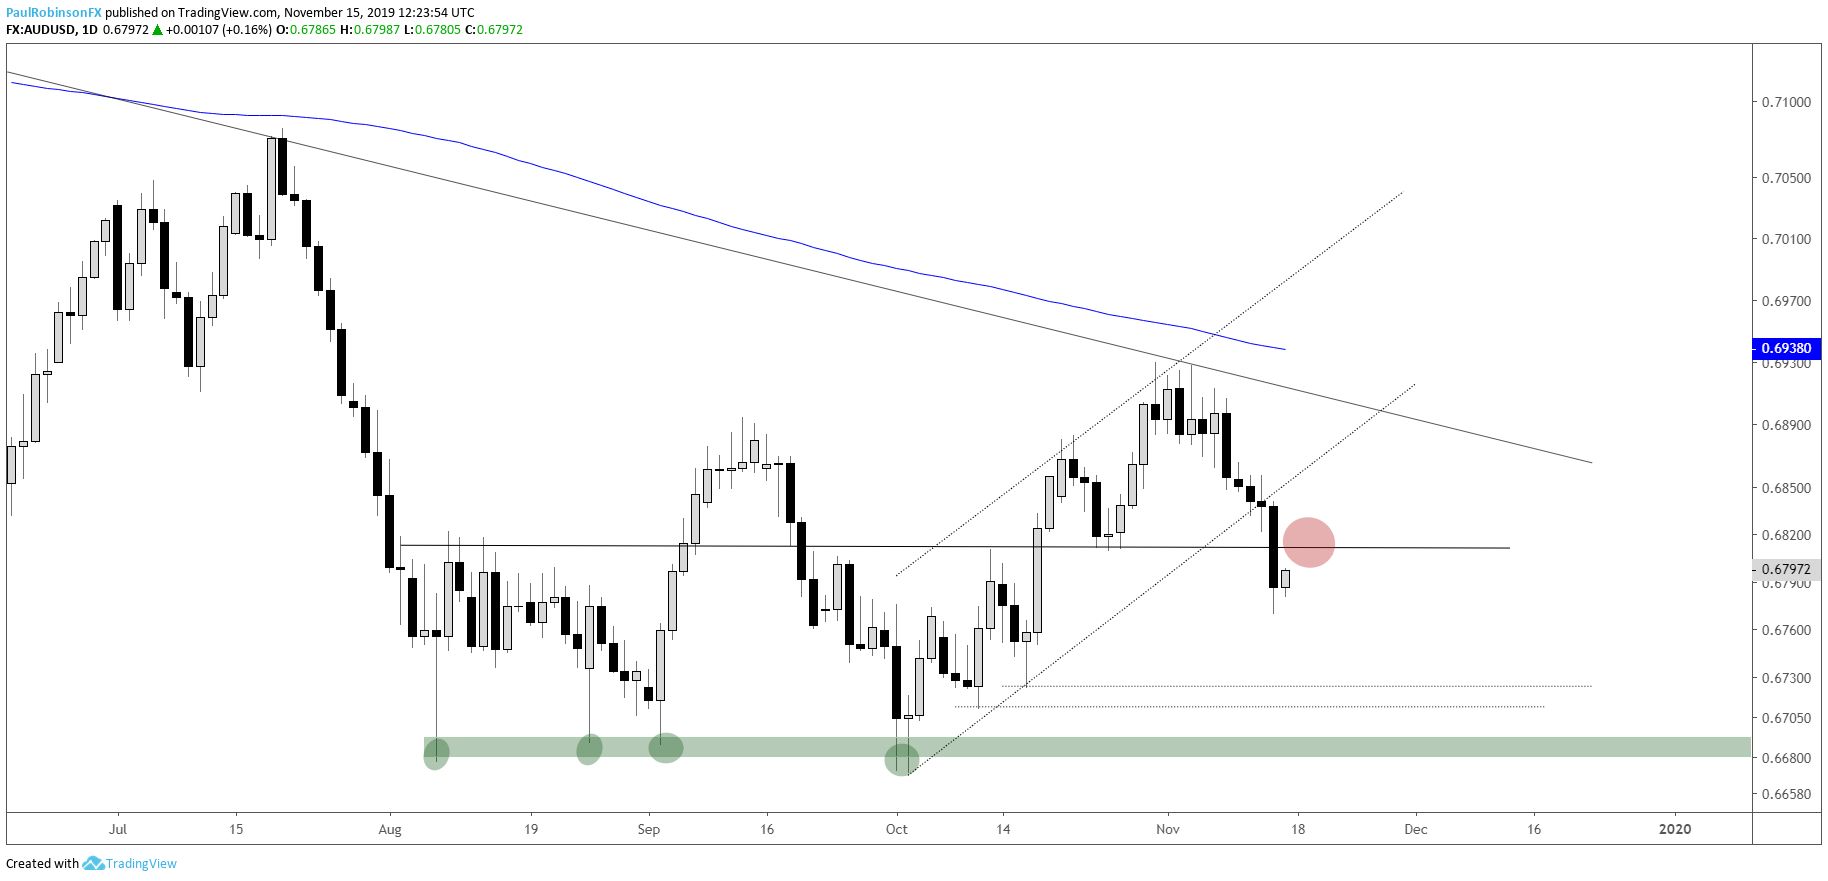
The Australian Dollar[1] took a hit yesterday after recently sliding off the December trend-line. The sudden plunge lower on employment data put it through important support around the 6800-line. This has focus on lower levels as we head towards a new week.
Old support becomes new resistance on any bounce from here. Looking to lower prices, the area just under 6700 will be in focus as the next targeted zone of support for AUD/USD[2]. It was tagged several times between August and October, which should make it a strong form of support. There is minor support at 6723/10 along the way.
AUD/USD Daily Chart (path of least resistance is lower)
AUD/USD Chart by TradingView[3]
NZD/JPY[4] has been stock in a tight range the past few weeks, but something has to give soon. The back-and-forth price action is unfolding around a major level dating all the way back to 2009. If the broader downtrend is to once again reassert itself, look for an eventual bearish break below 6887.
A break below there would likely spur a move to at least the August trend-line, currently just under 6800. The back-and-forth we have seen since the summer bottom could be taking on a large bear-flag, but that won’t be validated until the lower threshold is broken.
A top-side break of the range will have price also above the March trend-line, but quickly up against the top of the potential bear-flag discussed. And allowing for a little wiggle room around the 2009-present level, it wouldn’t yet be a convincing recapture of resistance. This would warrant caution on running with a bullish bias. For now, the ‘easier’ path appears to be on the downside.
NZD/JPY Daily Chart (watch for range-break)

