

US Dollar Talking Points:
US Dollar Bulls Push in November
The bullish November theme in the US Dollar[1] has continued as DXY has pushed right back into a zone of key resistance that runs from 98.33-98.50. This was the same zone that held the yearly highs in April and May of this year. Buyers were eventually able to pose a topside break through the late-portion of this summer but bulls were unable to hold the move, leading in to the rising wedge formation that was looked at in the Q4 Technical Forecast for the US Dollar[2]. October brought a strong theme of weakness that ran for pretty much the entirety of the month as USD set a fresh two-month-low on the first trading day of November.
Since then, however, its been a far different scenario as buyers have come back to the table to retrace 50% of last month’s sell-off, with price action[3] finding resistance in this confluent zone on the DXY chart.
US Dollar Daily Price Chart
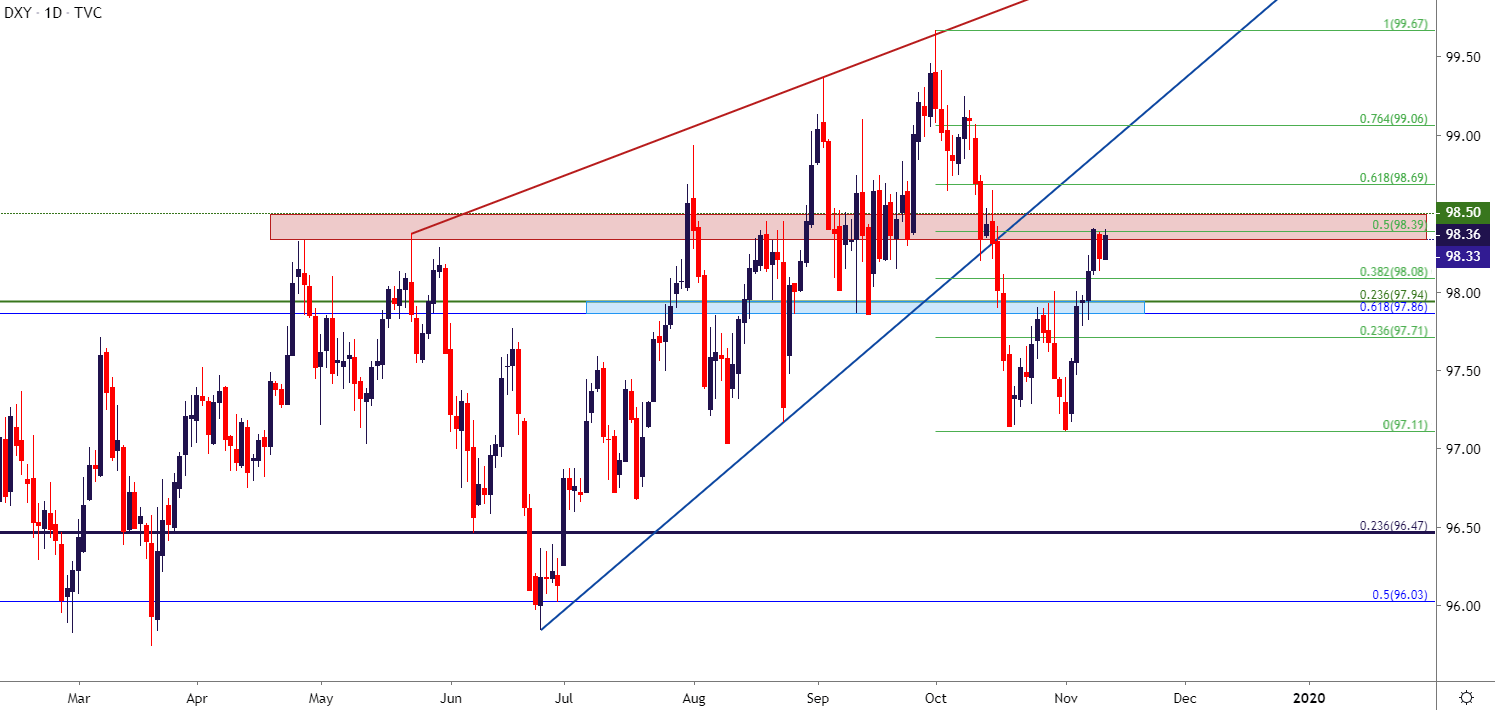
Chart prepared by James Stanley[4]; US Dollar on Tradingview[5]
AUD/USD: Trendline Reaction, Can Sellers Continue to Push?
On the long side of the US Dollar, AUD/USD remains compelling[6]. With last month’s USD sell-off, AUD[7]/USD lifted all the way from an October low below the .6700 level to a key level of resistance around the .6900 handle. As USD-strength has come back in November, that bearish trendline reaction has hastened, and this keeps the door open for short-side strategies in the pair; particularly for traders that want to look for a deeper move of strength in the US Dollar. Next stops of support could be sought around the .6809 swing low followed by
