

The Japanese Yen[1] is down more than 4.8% against the US Dollar[2] since the August yearly extremes with USD[3]/JPY[4] rallying into a critical resistance threshold at fresh five-month highs this week- we’re looking for a reaction up here. These are the updated targets and invalidation levels that matter on the USD[5]/JPY weekly price chart. Review my latest Weekly Strategy Webinar[6] for an in-depth breakdown of this Sterling price setup and more.
New to Forex[7] Trading? Get started with this Free Beginners Guide[8]
Japanese Yen Price Chart – USD/JPY Weekly
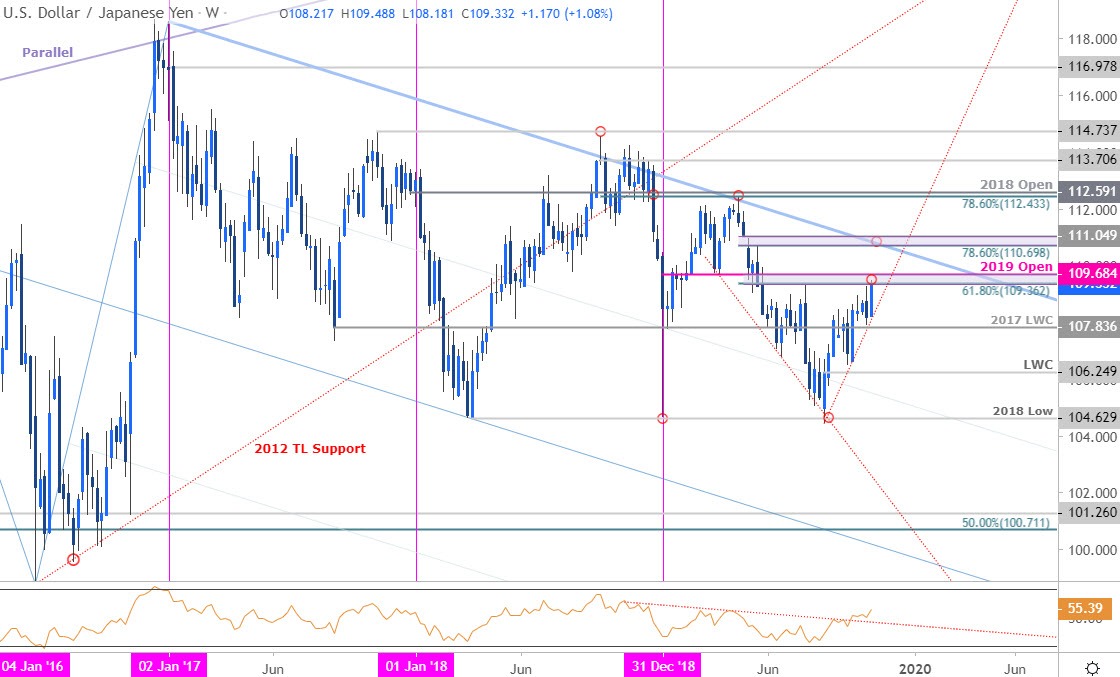
Chart Prepared by Michael Boutros[9], Technical Strategist; USD/JPY on Tradingview[10]
Notes: USD/JPY is testing a critical resistance barrier at 109.36/68 – a region defined by the 61.8% retracement[11] of the yearly range, the March low / July high, and the objective yearly open. The broader August recovery is vulnerable while below this threshold near-term and the focus is on a reaction off this mark.
Initial support rests with the August trendline[12] backed by the 2017 low-week close at 107.84. Broader bullish invalidation now raised to the yearly low-week reversal close at 106.25- a close below this level would be needed to mark resumption of the broader downtrend. A topside breach / close above 109.68 keep the focus on the next major resistance zone at 110.70-111.05 – look for a bigger reaction there IF reached.
For a complete breakdown of Michael’s trading strategy, review his Foundations of Technical Analysis series on Building a Trading Strategy[13]
Bottom line: The USD/JPY rally is now testing key resistance at multi-month highs and leaves the immediate advance vulnerable near-term
