

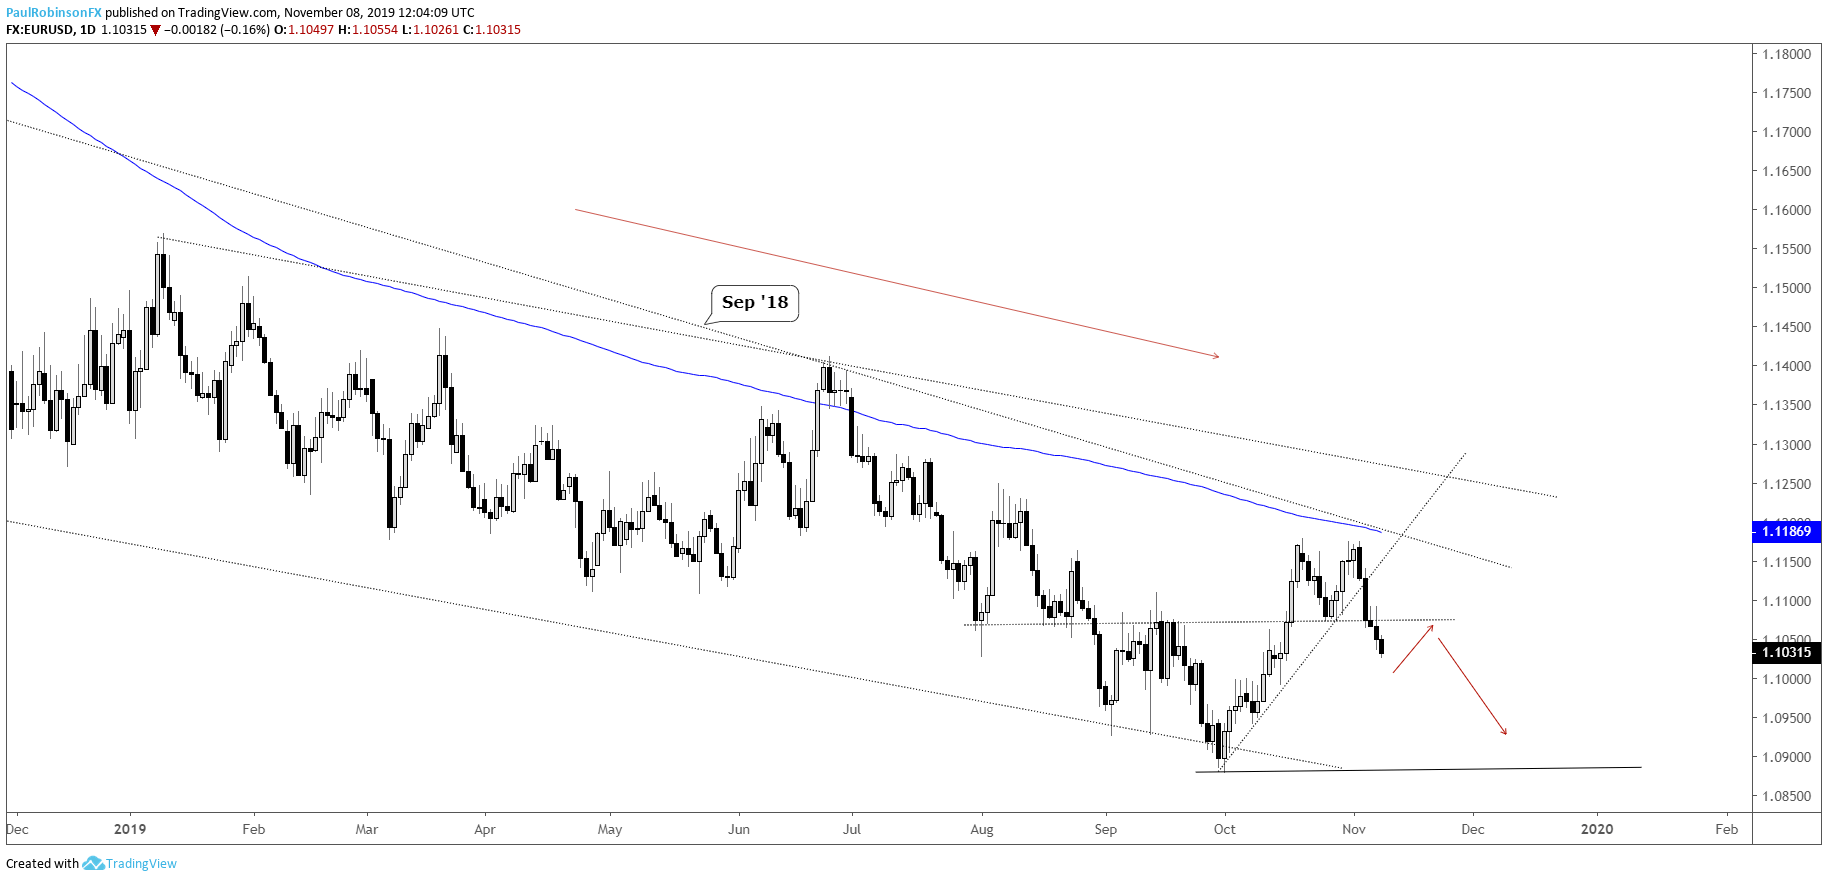
The Euro[1] looks like it is headed lower after breaking a near-term trend-line and price support at 11072. It will likely be a bumpy road lower, but with time the October low, then gap-fill from the April 2017 French election and 200-day MA combo are reasonable targets in the week ahead. Selling rallies is the preferred approach. For more, check out this in-depth technical piece on EUR/USD[2] written this morning.
EUR/USD Daily Chart (looks headed lower)
EUR/USD Chart by TradingView[3]
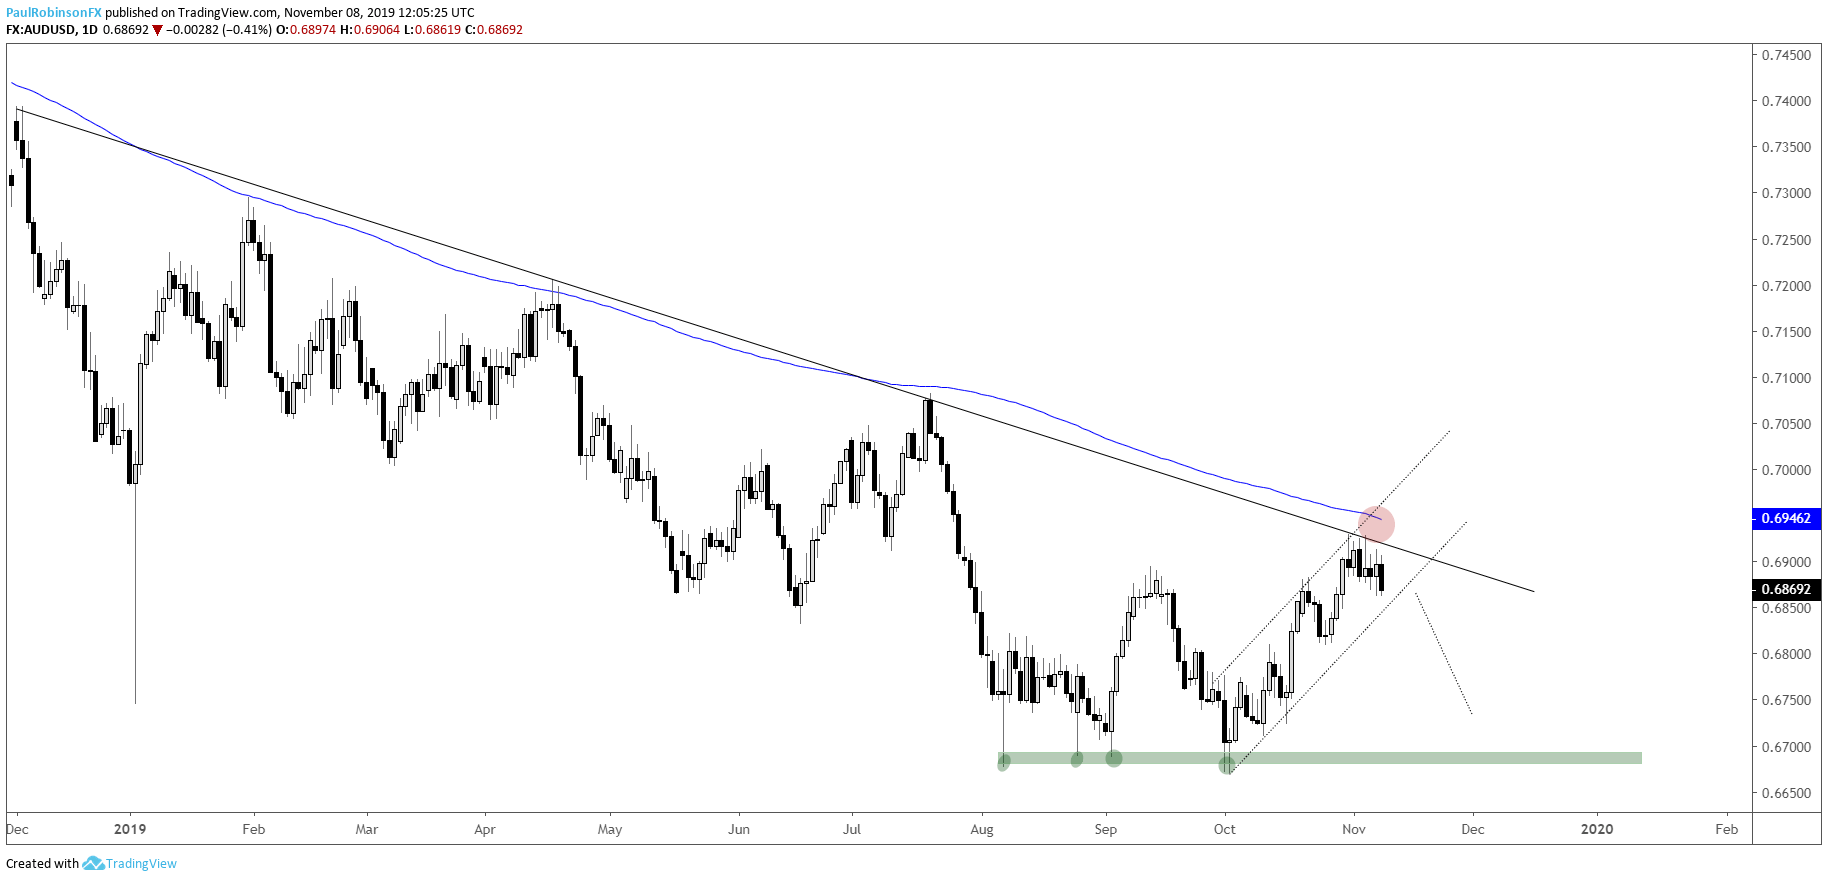
AUD/USD[4] hit its head on resistance via a trend-lime from last year. The turn down has the channel off the low in focus, a break of the lower parallel could have the pair trading at the bottoms from August-October in the 6700/6670 region.
AUD/USD Daily Chart (could soon pick up downside momentum)
AUD/USD Chart by TradingView[5]
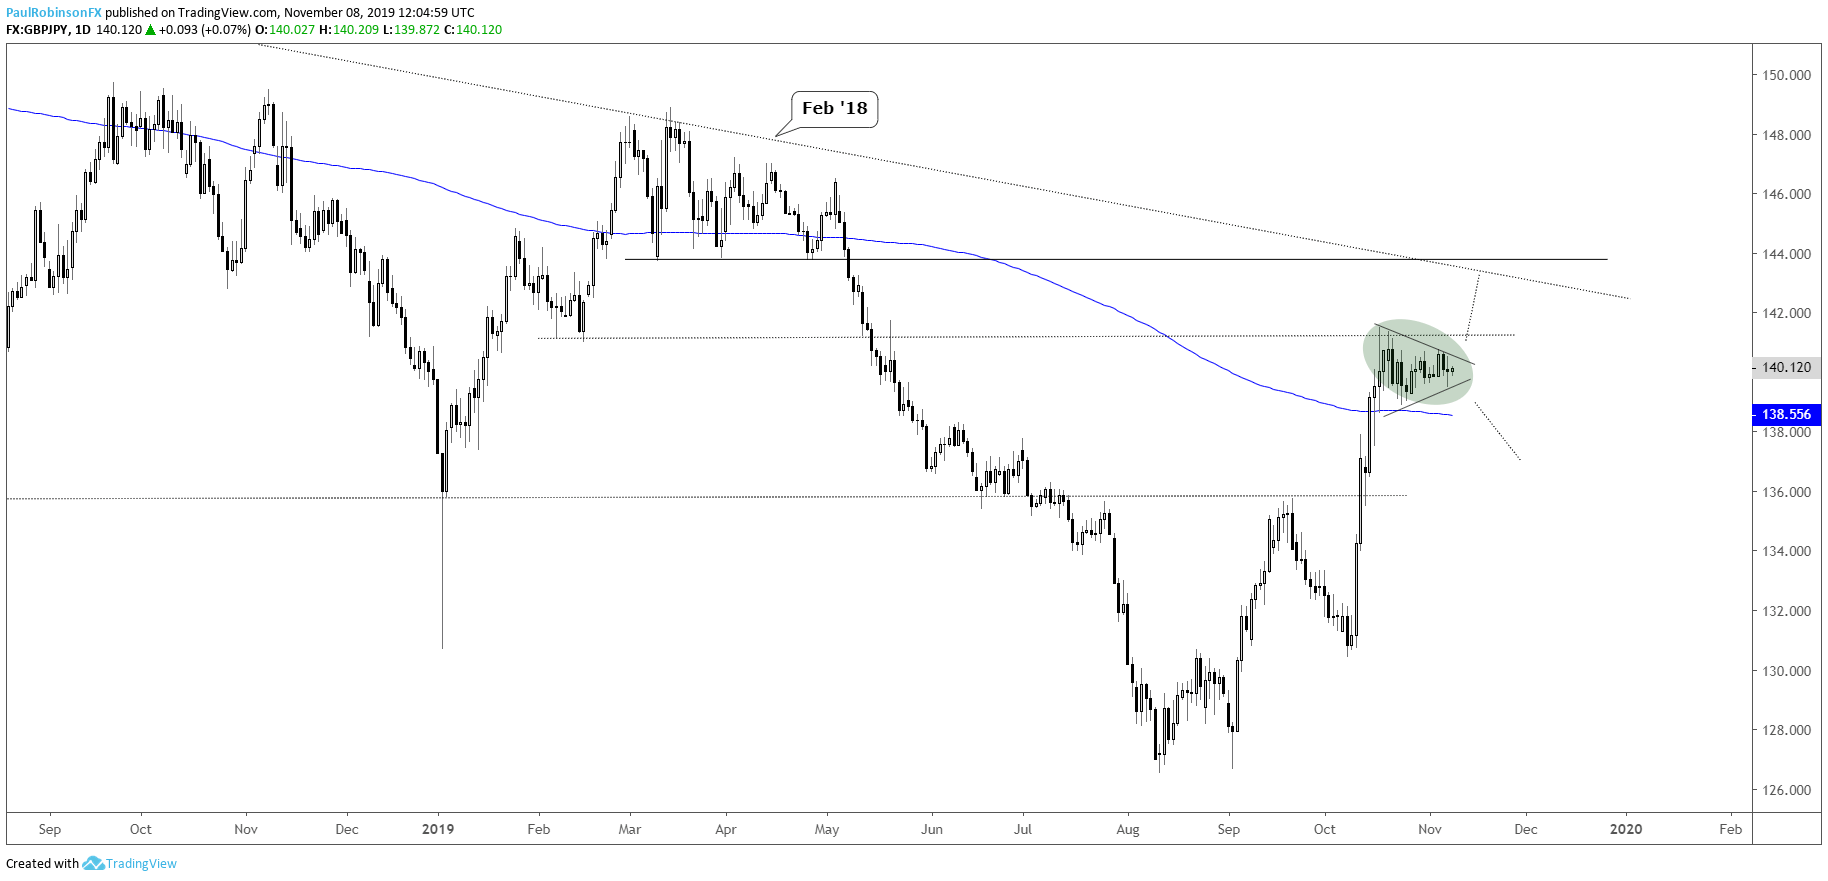
GBP/JPY[6] is maintaining the rally last month by building a symmetrical triangle. This leaves it poised to continue higher towards the 14400 level, but the pattern will need to break first and at least put price above 14075. There is still risk of a roll-over which leads to a pullback to the 200-day or worse.
GBP/JPY Daily Chart (symmetrical triangle)
GBP/JPY Chart by TradingView[7]
NZD/JPY[8] is up against a pretty serious level of resistance around the 6950-area. It’s a fairly exact level as even though it spans a decade, the highs and lows associated with the level are fairly precise even on the daily time-frame. This level is also in confluence with the trend-line off the March peak. A break below recent support at 6896, out of the recent trading range, should have NZD[9]/JPY[10] rolling downhill towards the trend-line off
