

Gold Price Talking Points:
Gold Prices Hold Key Resistance
The first week of Q4 has been quite the change-of-pace so far. After driving into the new quarter with a full head of steam, the US Dollar[1] has turned-lower and this helped to prod the pullback in Gold prices[2] that I had been looking for a couple of weeks ago. Gold prices pushed down to a low of 1460 last Tuesday, the first day of Q4 trade; and as the USD pullback has continued[3] through some rather key data prints, Gold prices pushed up to a key area of resistance.
As looked at last Thursday, that bigger picture bullish trend may not yet be ready for continuation and with near-term price action holding resistance at a prior area of support, that scenario remains the same as we move into a fresh week.
Gold Price Four-Hour Chart
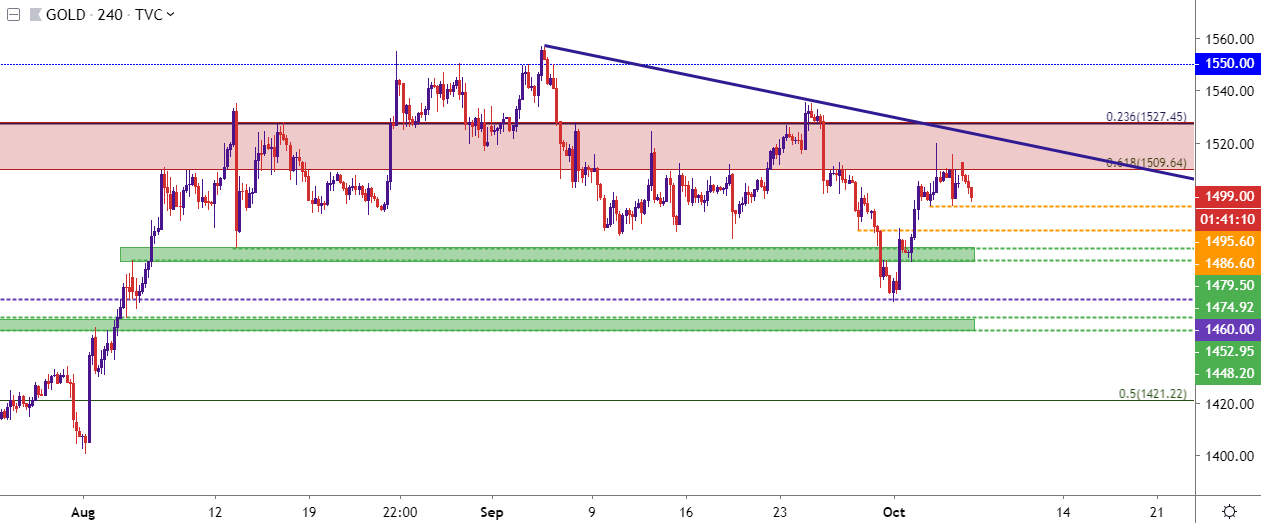
Chart prepared by James Stanley[4]; Gold on Tradingview[5]
Gold Prices Bigger Picture
Taking a step back on the charts and it’s the potential for another 2011-type of trend that keeps the bullish side of the matter as attractive. And this meshes from a fundamental view, as 2011 was a period in which global Central Banks were all looking at looser policy options to continue the recovery from the Financial Collapse. Fast forward eight years later and a similar backdrop has developed around some of the world’s largest CB’s, the Federal Reserve included, and this is part of the reason for the persistent bullish backdrop over the past year in Gold prices.
As looked at last month, Gold prices on the weekly chart had become more overbought than at anytime since 2011. Playing into that scenario was a key area
